Learning Analytics Specification
| Learning Analytics | |
|---|---|
| Project state | Planning |
| Tracker issue | XXX |
| Discussion | XXX |
| Assignee | XXX |
Note: This page is a work-in-progress. Feedback and suggested improvements are welcome. Please join the discussion on moodle.org or use the page comments.
This is a specification for a Learning Analytics system including an API for collection of learning analytics data and a number of interfaces for presenting this information.
The specification started at the Learning Analytics working group during MoodleMoot US 2015 (course, notes).
What are Learning Analytics?
Learning Analytics are any piece of information that can help an LMS user improve learning outcomes. Users include students, teachers, administrators and decision-makers.
There are a number of reports, blocks and other plugins for Moodle that provide analytics. A list of Learning Analytics plugins is listed in the user docs.
Why is a Learning Analytics system needed?
Although there are already a number of sources of learning analytics, there is no API or consistent source of learning analytics that combines data from multiple sources and makes it accessible to plugins throughout Moodle.
Learning analytics are needed to inform teachers about students, to inform the staff that support teachers and to inform students themselves. The primary need for learning analytics has been identified as promoting student retention by identifying student's status (at risk, normal, ahead), based on their activity.
A learning analytics system should be:
- predictive (combining data to show current status and enable prediction of future status)
- proactive (messaging users when action is needed to change status)
- verifiable (able to compare predictions to actual outcomes to measure accuracy)
A learning analytics system will be able to make use of pre-fetched data that can be combined in varying ways, on the fly.
Predictions will use models (weights applied to source data) based on institution/organisation calibration and able to be adjusted on the fly.
Learning Analytics data gathering API
XXX DESCRIPTION OF API XXX
Sources of Learning Analytics
Each of the designated Learning Analytics sources should be collected so they can be included/excluded in combined calculations on the fly. Teachers and other users should be able to manipulate weights to explore the effect this has on student models and predictions.
If pre-calculation of values is required, this should be done regularly as a background task so values are available for combination as needed.
The following values were identified as important learning analytics that need to be made available.
- Course access/views (useful early in course) (on the fly DB access)
- Activity/resource views, reads (event observer, using R in CRUD)
- Activity resource submissions, postings, etc. (event observer, using C,U in CRUD)
- Gradebook current grades and course grade (on the fly DB access?)
- Completion status, if used (on the fly DB access)
- Assessment Feedback views (quiz, assignment, workshop, others?) (events observer, specific events)
- Interaction between students (Social Network Analysis) (forum posts vs views, diversity of interaction vs number of) (pre-calculated from DB)
A learning analytics source API is a pluggable system so that additional sources can be added. each source would need to store learning analytics when required or on a regular basis (depending on what needs to be gathered/calculated) so that it is ready to be combined in status calculations based on a particular configuration (student model).
Sources of analytics produce a floating point value between zero and one. This value limitation is important so that learning analytics can have relative meaning. The way of calculating this value will differ for each source because they are drawing on different information. Such information may be calculated based on:
- a proportion of a possible maximum grade/value,
- a normalised relative score for a user within a context,
- events taking place in relation to expected dates (eg., submitting before a deadline) or
- a more complex algorithmic combination of information.
LA sources themselves may have some configuration so they can be tweaked under different circumstances (such as education sector or class scales). Such configuration would probably be limited to the site level.
Sources should continue to work when there is an absence of relevant information on which to base a calculation. When this is the case, zero values should be returned.
Some sources would relate to multiple activities. For example, viewing may related to different activities/resources within a course. ??? IS IT BEST TO COMBINE THESE OR SHOULD THEY BE SEPARATELY STORED ANALYTICS ??? BIG DECISION: GRANULARITY VS SIMPLICITY ??? IF SEPARATED, EACH LA SOURCE WOULD NEED ITS OWN CONFIGURATION ???
Data structures
To calculate status of individual students, learning analytics values are combined as a weighted sum, according to a configuration, and stored as status values. These status values can be used by numerous interfaces via requests to the Learning Analytics API.
Learning Analytics
- User ID
- Context ID
- Source
- Timestamp
- Value {0..1}
Learning Analytics are gathered and/or pre-calculated pieces of information from LA sources. They relate to an individual user's (student's) success as reported by the source. Each calculated learning analytics value is stored so they can be accessed later. Usually only the latest values will be used.
Configuration
- Context ID
- Source
- Weight
- Revision
The configuration defines how learning analytics should be combined within a particular context (course). Each source is given a weight in the configuration and the weighted sum is calculated to form the student status.
Configurations can be validated when compared to final outcomes, such as course completion or course grade.
Configurations can be saved as revisions so that a series of status values can be recalculated later and so that the validity of different configurations can be compared.
Student Status
- User ID
- Context ID
- Status value {0..1}
- Status code {'At risk','Normal','Ahead'}
- Timestamp
Student status values are a constantly available for each user (student) in each relevant context (their enrolled courses). This information is available to various interfaces throughout Moodle.
Status values are the weighted sum of learning analytics values, calculated based on the configuration within the context (course). Status values relate to status codes, which denote whether the user (student) is at risk, making normal progress or is ahead within the context (course).
Student status values would need to be recalculated when there is an event within the context that would effect one of the learning analytics relating to the student; such recalculations would prompt each relevant learning analytics value to be fetched (which may require data gathering) and a new combination of these values based on the configuration. Only the latest status value needs to be kept. If old status values need to be recalculated later, the calculations can be redone based on configuration history and the record of past learning analytics values.
Interfaces
The development includes a number of interfaces. Initially, a basic set of interfaces will be developed, but the system will be able to be expanded, with future interfaces possible.
Configuration Interface (narrowest audience)
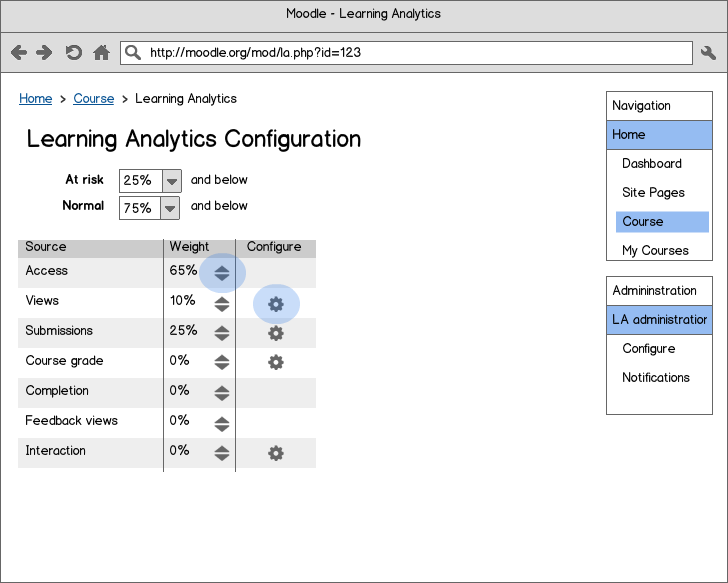
The configuration interface is a mandatory part of the system. It allows teachers/administrators to control which learning analytics sources are involved in status calculations, their weights and their configuration. A configuration is relative to a specific context (course).
- Thresholds can be set for status values at risk and normal, implying a threshold for ahead.
- Each available source is listed in a table of sources. As the LA API is extensible, this list is not fixed and sources could be added and removed.
- Each source has a weight {0..1}, represented as a percentage. The sum of all weights must always sum to 1 (100%). Weights can be adjusted up and down, with the weights of other sources dynamically adjusting to compensate. Adjustments will be saved ??? When weights are adjusted, how should other weights change to compensate? ???
- When a source has a weight of zero, it is not included in status calculations and the source will not appear in other interfaces. To include a source in calculations and to show it on other interfaces, its weight will need to be increased above zero.
- Sources may have the potential to be configured, although this may not be the case for all sources. Configuration may include tweaking how the source presents it's score for students, such as the include/exclusion of certain activities. The configuration will appear in a form presented by the source and this configuration interface will differ between sources. The configuration set for an individual source will be relevant to context (course). It is assumed that in most cases, a default configuration for a course will be sufficient for most teaching situations.
- At the site level, thresholds and a default set of weights can be established and applied for new courses. In this way, a relevant default setup can be created for an institution and the general way that teaching happens there. The learning analytics system should be able to work, even if the configuration interface is not visited.
List of students sorted by status (teachers, support staff)
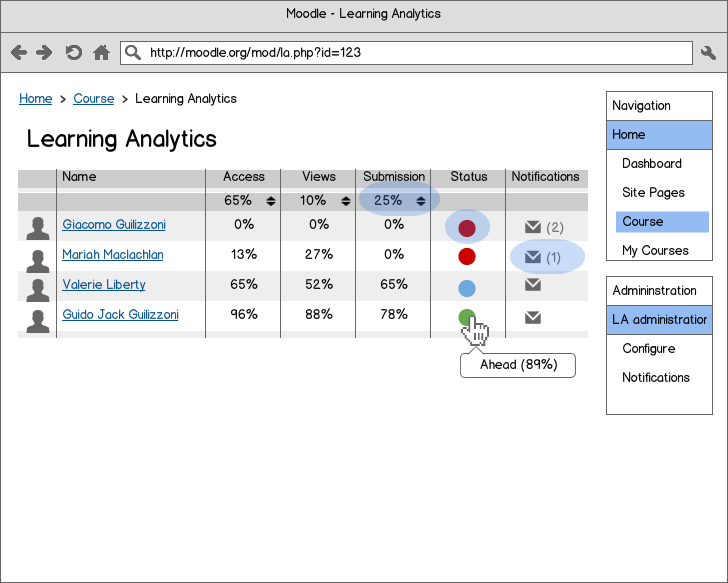
The list of students in a context (course) will be displayed on one page, with their status value and number of notifications sent from the learning analytics system. The list of students is always sorted by status value, but may be filtered.
- The list is always sorted by status value, with students having the lowest status values (towards at risk) being noted at the top of the list and ordered downwards towards students whose status is normal or ahead. This sorting denotes the relative performance of the student in the class.
- When the size of the class exceeds a certain number, it may be useful to include pagination. To assist in finding individuals, filtering by name may be included.
- The row below the table header includes controls for on-the-fly weighting adjustments. (These controls should be visually different to ones that indicate sorting). When weights are adjusted, other weights will dynamically compensate and adjustments will be saved automatically. The effect of weighting changes will be an immediate recalculation of status values, potentially reordering students and providing new status icons.
- The status column will include a colour-coded status icon. These colours will need to be configurable at the site level as colours meanings can differ in different cultures; also, some simtes may wish to match status icons to theme colours. The default colours will be:
- red for at risk
- blue for normal
- green for ahead
Hovering over the status icon will reveal the status and status value (as a percentage).
- Notifications sent to students from the learning analytics system will be shown. An envelope icon appears with the number of notifications beside it (when greater than zero). Clicking on the envelope takes the user to the notification interface, where they can send a notification to the relevant user (student).
Detail view per user (student)
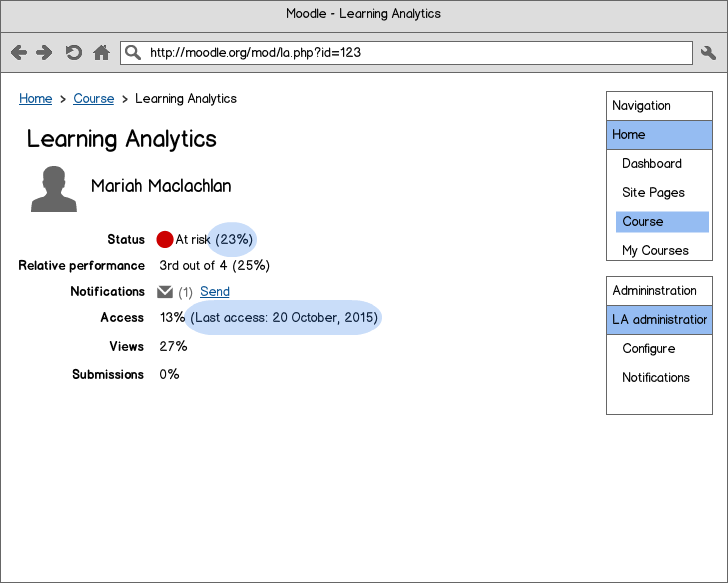
The detail view shows details for an individual user (student).
- The status icon is shown with the textual term for the status and the status value (as a percentage).
- The relative performance of the user is given in relation to other users in the course. This represents their position in the course and a percentile is also given.
- The number of notifications sent from the system can be seen and there is an explicit link to allow individual notifications to be sent to the user.
- Components of the status, from each source, are given and there could potentially be additional information provided by the relevant source (such as the last access date).
- ??? What other information could be shown on the Details view page? It's not much more informative than the table. ???
Push notifications (widest audience)
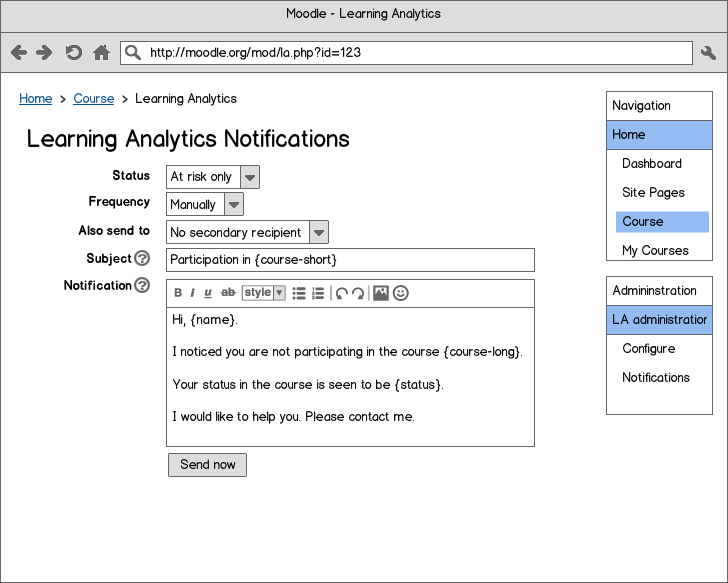
The notification interface allows notifications to be sent to users in response to their status. This interface is similar to the messaging interface, but needs to be independent from it so that:
- notifications can be sent based on triggers,
- specific information can be included in notifications and
- notifications can be tracked in relation to the learning analytics system.
- Notifications can be sent to a group of students who have been identified as at risk or to everyone in the course.
- Notifications can be sent at a certain point in time, for example, every two weeks, or they can be sent manually (default).
- Notifications sent to students can also be sent to other users as a way of tracking notifications. The list of secondary recipients would be based on roles in the course, excluding those based on archetypal student roles. For example, a teacher could be sent notifications at the same time they are sent to students. If other roles are defined in the course, such as a manager or mentor, these could be nominated as a secondary recipient.
- The message subject and body can contain place-holders, replaced by values when the message is sent. Help will need to be provided to use these place-holders.
How it works
XXX
Learning analytics source value calculations
Status caclulation
Thresholds for status codes
Benefits
- XXX
Usage scenarios
- XXX
Future work
XXX
Other potential extensions to the system
- Reporting of resource/activity effectiveness in contributing to learning outcomes
- Potential for students to opt in/out of data collection, analysis, reporting or exports. This may be necessary in some places. It might be possible to have student logging be anonymous or exported anonymously.
- Ability to export data as a static dump or as a stream of analytics information, possibly conforming to the IMS Caliper standard, for extra-system analysis.
- Third-party plugins that use the Learning Analytics API
Other potential sources of Learning Analytics data
There are other possible sources of Learning Analytics. As well as those suggested above, here are some additional potential sources.
- performance in other courses enrolled (now & previously)
- student ratings on forums
- self-evaluation
- history of activity within the current course
- history of course activity within a faculty/category
- mood/sense-making
- activity in relation to deadlines
- time spent online based on activity captured through JavaScript
- demographic/profile data
- year/progress
- past grades, prior credit, GPA
- completion of prerequisites vs recommended prerequisites
- personal background
- native language, exceptionalities / accommodations
- cross-instance performance across multiple Moodle instances
Other potential interfaces
- An institutional summary view showing an overview of student retention in courses
- Activity restrictions based on risk status based on learning analytics
- A block showing a student their current status and linking to their details, showing teachers a list of students (with at risk status?)
- A profile page element showing the student's status


