Note: You are currently viewing documentation for Moodle 4.2. Up-to-date documentation for the latest stable version of Moodle may be available here: Dynamo.
You organize group work and you dream of a tool which indicates the groups in difficulty and which gives you an idea of the involvement of each one? The UCLouvain pedagogical development fund has financed the development of the Dynamo activity for these purposes!
The Dynamo tool is based on a peer evaluation of group dynamics. Each student is asked to evaluate the other members of his or her learning group on several dimensions (responsibility, expertise, attitude, etc.), and to evaluate himself or herself. These evaluations are then processed to
provide teachers with indicators that allow them to diagnose at a glance which groups are in difficulty and which dimensions of collaboration need to be addressed;
objectify, on the basis of self and peer evaluations, the potential conflicts and the degree of commitment of each member in a group;
provide teachers with tangible information, anchored in student assessments, to discuss with them any problems encountered in their group during the course of the work;
offer teachers, on the basis of these same assessments, the possibility of weighting the collective work by an individual mark reflecting the contribution made by each student, based on the validated NIWF implication indicator.
Video demonstration
Coming soon ...
Discover the group dynamics evaluation grid
The evaluation grid for group dynamics includes the following criteria :
Participation: meetings, punctuality, respect for group rules;
Responsibility: accomplishment of tasks assigned by the group and respect of commitments (reading, research, writing, etc.);
Scientific expertise: richness and quality of research, rigor in the use and formulation of scientific ideas and concepts;
Technical expertise: ability to use methodological and technical tools to carry out activities (software or hardware, research methods, protocols, bibliography, citation of sources, etc.);
Attitude : team spirit, respect for people, contribution to the cohesion of the group and to a good working climate, quality of listening and openness;
Personalized criterion (optional): the teacher can define a personalized evaluation criterion specific to the organized work, for example to evaluate the quality of exchanges between groups.
The first 5 criteria have been selected on the basis of a pedagogical survey on group dynamics. They are mandatory because the quality of the indicators generated depends on them. The teacher can only add personalized elements to better describe the imposed criteria.
The participants are asked to evaluate each group member according to these criteria on a 5-level scale. They are also asked to self-assess and eventually rate their group overall on the 5 (or 6) criteria.
Dynamo activity evaluation grid
Individuals are also asked to complete 2 open-ended comment fields:
a comment on their contribution to the group;
a comment on the functioning of the group in general.
Dynamo activity grid, open comments
Precautions for your groups : a grouping is mandatory and groups changes are delicate
Before to use Dynamo, you need to previously associate a grouping with the groups that will be participating in the evaluation.
If you not yet created your groups, be careful and create your groups while specifying an associated grouping name.
You can also use our TeamUp plugin to create groups based on criteria, this plugin forces the grouping definition.
The Group Choice plugin is also very commonly used to enable students to enrole themselves in groups, and it also supports working with a grouping.
Do not start your Dynamo activity if your groups are not stabilized. The wisest way to manage group moves is to remove the affected group(s) from the grouping, add one or two new groups to the grouping, pour the students into the groups manually, and invite the students to redo the assessments.
Create a Dynamo activity is very simple ...
Once you take the above precaution, the Dynamo activity configuration only supposes to specifya title fot the activity and the grouping name. All other parameters are optional.
Create a new Dynamo activity
The 5 default evaluation criteria have a default description and teacher may add information to this description if wanted :
Dynamo custom description of criteria
The sixth optional criteria and its description may also be defined in the dynamo creation form :
And other default option are also present, like activity completion that may be linked to the fact the student completed the evaluation.
Once this activity is set up, you can preview the form via the Preview tab. If everything is set up correctly, you can invite students to complete the assessment, making sure to motivate the formative process to ensure the highest possible response rate (completion condition).
As the assessments are completed, you will see the results change on the Results and Report tabs. Note that the List of participants with no answer report shows you the list of participants who did not complete the evaluation form, so that you can make targeted follow-ups.
WriteUp No Response Report
Presentation of the 5 dynamo indicators
Indicator
Target
Interpretation
Visuals
Relative implication
Individual
= 1 Student contributed as much as others to the work.
Indicates for each student whether there is consistency/variance in peer assessments
(for ease of reading, the variance has been amplified to show a number on the order of 1)
consistency less than or equal to 0.15
consistency between 0.15 and 0.25
consistency between 0.25 and 0.6
consistency higher than 0.6
Cohesion
Group dynamics
Indicates a degree of group cohesion through visual indicators
(calculated on the basis of the average variance of students in the group)
indicates a group with perfect cohesion (suspect, students may have agreed on the grade)
indicates a group with very good cohesion
indicates a group with low cohesion
indicates a group with poor cohesion
indicates a group that is most likely in conflict
Climate
Intervention urgency
Compiles the 4 previous indicators and their severity level to generate an overall visual indicator that shows the degree of urgency of intervention.
5 levels of urgency, from least severe to most severe:
Analyze results and organize feedback
Students have no automatic feedback on group evaluations via the platform. It seems too delicate to communicate the indicators to the students without an associated discussion, in particular in case of difficulty. It is therefore important to organize feedback for the groups, taking care in particular to provide regulation in the groups where the dynamics can be improved.
The Results (in the tab of the same name) are presented in 3 views:
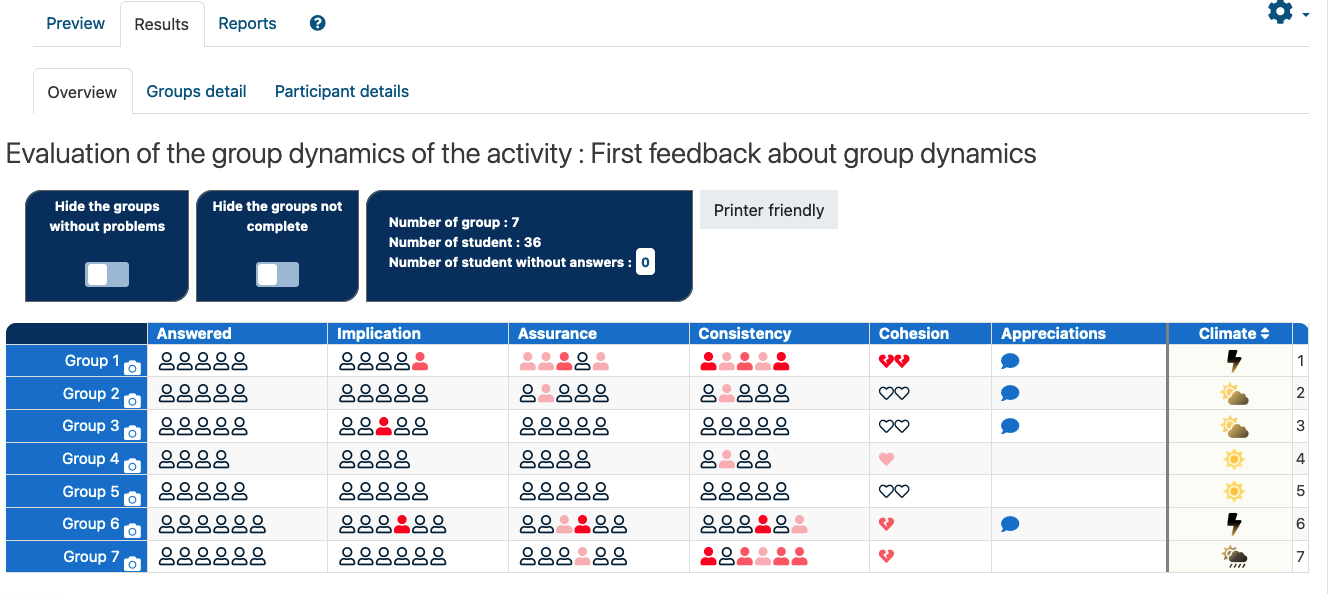
Overview: this steering table that presents the list of groups with synthetic visual indicators; each member of a group is represented by a person icon and you can view the names and photos by hovering over the icons;Note that the Appreciations column indicates when some students explicitely cited a group member's firstname in open comments.
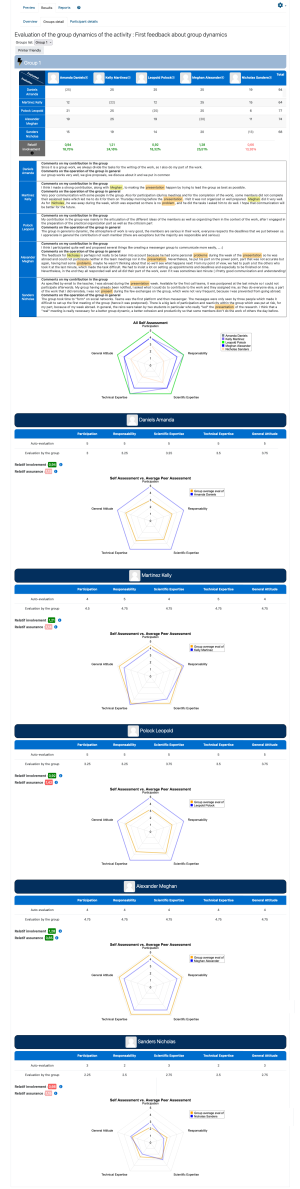
Group Details: presents indicators for analyzing group dynamics and open-ended comments, with graphs that compare individual ratings with peer ratings based on different evaluation criteria;Dynamo results : group détails
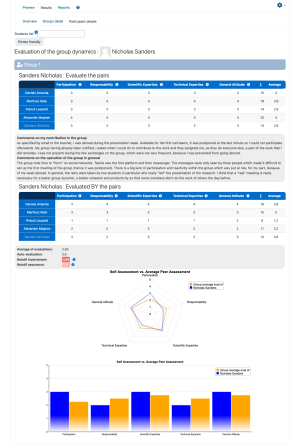
Participant details: presents all the data on an individual.Dynamo results : participant details
In each of these views, the indicators of concern are highlighted in color according to the degree of seriousness.
Dynamo also generates various Reports (via the associated tab):
the list of unanswered participants (for follow-up);
the groups' yearbook;
Group reports: displays all group reports on one page (for printing or exporting as a pdf via the browser);
Individual reports: displays all individual reports on one page (for printing or exporting as a pdf via the browser);
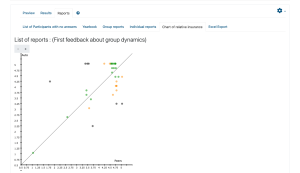
Relative insurance chart: clearly highlights the individuals who are overestimating in the group (to be met as a priority);Dynamo report : relative insurance chart
Excel export: this export allows archiving of all Dynamo activity data in a single file.
To organize feedback to the groups,
we advise you to focus on the groups in difficulty based on the column "Climate" in the overview. You can sort your list of groups based on this criterion;
for these groups, analyze the group and individual results, you can also print them out (use the pdf printing possibilities of your browser to generate a pdf file)
also consult the reports (Reports tab) for information, including the "thumbails" which can be useful and the "relative insurance chart" report which clearly highlights students who are overestimating themselves;
meet with groups or individuals who are struggling.
The first uses of Dynamo have shown that often, when there are difficulties in a group, several indicators turn red. A student is not present enough, he/she over-evaluates himself/herself in the hope that his/her disinvestment will go unnoticed, and all of this compounds to generate critical indicators of coherence and cohesion... Open comments help to interpret the situation and individual student difficulties such as health problems or family problems.
Please note that it can happen that several individuals join to give inappropriate bad feedback on a person. It is therefore advised to provide for the possibility of appeal through direct contact with a teacher. It is through a discussion that you can bring out the problems.
Exploit the individual implication mark to weight the grades
The relative implication indicator was designed to allow instructors to take the measure of each student's involvement in a group assignment. This indicator was built on the basis of solid bibliographic references and can therefore be used to adjust the grade.
Caution! The use of the relative involvement indicator to modulate the grade implies that you make sure to announce this evaluation modality from the start. Do not use Dynamo only for certification purposes. We indicate below some ways to use the results to generate a grade, but it is essential to propose this activity several times for formative purposes, before considering using it for certification purposes !
The ideal formula to use to adjust grade is still to be constructed...
But here are the recommended ways to use it:
knowing how to work in a team is part of the cross-curricular competencies of many course programs, but students need to have formative feedback before receiving an associated grade; therefore, be sure to make at least one formative use of dynamo Dynamo at the midpoint of the course and be sure to provide feedback to groups and/or individuals who are struggling, via a meeting associated with a discussion;
then plan a dynamo Dynamo certificate activity at the end of the course and take into account the relative involvement to weight the group grade to generate an individual grade for the work;
an example of a formula used by a teacher to mitigate the impact of relative involvement (70% grade weighting): Individual grade = Group grade * [0.7 * Relative involvement + 0.3]
some teachers explicitly targeting teamwork skills go beyond this and propose a direct weighting of the grade by relative involvement (100% grade weighting): Individual grade = Group grade * Relative involvement
others provide for a maximum correction margin so that the difference between the individual and group score remains within 10% of the maximum score (maximum 2 points difference for a score out of 20).
To easily exploit the relative engagement indicator, use the spreadsheet export of the data available via the Reports tab. The individual indicators are listed in the second sheet of the spreadsheet file.
Dynamo relative implication in spreadsheet export
Exploit the marks to have grade for group dynamics
If teamwork is on the list of cross-curricular competencies to be practiced and evaluated in your course, we suggest that you use Dynamo at various times during group work to regulate group dynamics.
It is rather delicate to use the indicators of coherence and cohesion for certification purposes, because group dynamics depends on a mix of individual and group factors. We therefore advise you to evaluate the progress of the students in their group dynamics and their consideration of the feedback during the different regulation discussions.
If you find an evaluation method that seems to be effective, do not hesitate to let us know at
Spreadsheet export of results
At the end of year, you will have to archive the results of the Dynamo activities of your course.
All the activity data are included in the spreadsheet export available via the tab Reports > Export xls > spreadsheet export.
The exported document contains 3 sheets :
a sheet with the group indicators;
a sheet with the individual indicators;
a sheet with the raw data.
Feedback and suggestions
If you are using Dynamo and want to send us comments or suggestions, do not hesitate to create issues on the Dynamo Github Project or to contact us via email address
People who contributed to this plugin
This achievement was made possible thanks to the synergy of a multidisciplinary team composed of the following people:
Bruno Schoumaker, in charge of the project and the search for an indicator to detect "stowaways";
Philippe Bocquier, in pursuit of an indicator of individual involvement to weight the notes;
Patrick Gerin, in search of conflict indicators and useful graphs for tutors;