Quiz statistics report
The quiz statistics report may be viewed by clicking on the quiz and accessing Statistics from the gear menu, or if using a non-Boost based theme, accessing Administration > Quiz administration> Results > Statistics
This report gives a statistical (psychometric) analysis of the quiz, and the questions within it. The top section of this report gives a summary of the whole quiz. The next section gives an analysis showing all questions in a table format. There are links in this section to edit individual questions or drill down into a detailed analysis of a particular question. The last section of this report is a bar graph of the percentage of correct answers (Facility index) and the Discriminative efficiency index.
The full report (overview, and detailed analysis of all questions) can be downloaded in a variety of formats, as can the quiz structure analysis table.
Reasons to look at the statistics report
There are lots of highly technical in the Quiz statistics, which is great if you are a data scientist or mathematician, but even if you are not, there is very useful information to help you learn about how well your quiz is helping your students, even if you don't understand all the technicalities.
Finding 'broken' questions
If everything is working well, then what normally happens is that students who got a high mark on the whole quiz are more likely to get each question right. If you make a mistake when you create a question, for example if you accidentally set the wrong response to be marked correct, what happens then is that the better students who get a higher overall mark are more likely to select the right answer, and get marked wrong. This shows up in the 'Discrimination index' column. If the number there is small, you may have a problem. A broken question is not the only thing that might cause this, so you need to go an investigate, but it is a worrying sign. Because of that, Moodle will highlight any low values in this column so they stand out.
Tip: look down the 'Discrimination index' column. If any numbers there are small, then investigate that question.
If you find a 'broken' question, there are various options. You may be able to edit the question and then regrade the quiz to fix the problem (but be very careful editing questions after they were attempted.) Or, you could to go to the the Edit quiz page, and set the mark for that question to 0 (zero-weight it).
Ensuring that random variants are fair
There are lots of different ways that randomization can be used when building a quiz. Sometimes you will have something like a topic reivew quiz that draws a selection of 10 question from a set of 100, but the case we want to consider here is when for each 'question' in the quiz, you have a few different but similar versions of the 'same' question. For formative quizzes that is good, because it gives students more chance to practise. For summative quizzes, it is good because it reduces the changes for copying. You can build this either using random selection from different categories like 'Variants of question 1', or you can do it with question types like Calculated or STACK that have internal random variants, or both. (For more details, see here.)
If you are doing this, particularly if doing this for-credit, you probably want to ensure that it is 'fair'. You don't want one variant to be much harder than the others. To see this, look at the subsidiary rows that show all the different questions that appeared in once particular place in the quiz. Look in particular at the 'Facility index', which is basically how many people got that question right. If those numbers are very different for different variants, that is is a sign the quiz may be unfair.
Tip: if using variants, look down the 'Facility index' column to make sure that all the different variants of a particular question have similar facility index.
If there is big variation in one questions, then you could zero-weight it. Also, if you are re-using the quiz in future, consider removing that variant, and adding a new one.
Of course, when you have variants like this, you should check that Discrimination index for all the different variants, to ensure that none of the variants are broken in that way either.
Understanding how students are responding to a particular question
When you set a particular question in a quiz, you normally do so intending to test a particular skill or bit of knowledge. However, can you be sure that is what you are really measuring?
As an example from this, there was an Open University 'Maths for Scientists' course, where they had a question which was supposed to test that the student could substitute some numbers in an equation, and computer the answer with their calculator. As is standard practice for OU science tests, students had to give the answer to the right number of decimal places (which had already been taught and assessed). However, when they look at the answers students had given, they found that many students had clearly computed the right thing in their calculator, but were then being marked wrong because they input too many decimal places. (http://oro.open.ac.uk/39669/ Jordan, 2014)
The statistics report makes this kind of analysis quite easy. As described below, if you click through to the details about a particular question, then at the bottom of that page it shows all the different responses that were given, whether they were marked right or wrong, and how many students gave each results.
This can be a good place to start looking if some of the checks above highlight a potential problem.
Another way you can use this information is, if you are using more open-ended question types, like Short answer or Numerical, then you may notice several students have made the same mistake. You might then go back end edit the question, to add specific feedback for students who have given that answer.
Tip: particularly if using open-ended questions, look at the Analysis of responses to see what answers sudents are actually giving.
Overall quiz statistics
Here are the details concerning information in this report.
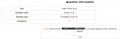
Quiz information
This section gives some basic information about the test as a whole. You will see:
- Quiz name
- Course name
- Open and close dates (if applicable)
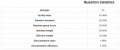
- Total number of first/graded attempts
- Average grade for first/all attempts
- Median grade
- Standard deviation of grades
- Skewness and Kurtosis of the grade distribution
- Coefficient of internal consistency (sometimes called Cronbach Alpha) - This is a measure of whether all the items in the quiz are testing basically the same thing. Thus it measures the consistency of the text, which is a lower bound for the validity. Higher numbers here are better.
- Error ratio - the variation in the grades comes from two sources. First some students are better than others at what is being tested, and second there is some random variation. We hope that the quiz grades will largely be determined by the student's ability, and that random variation will be minimised. The error ratio estimates how much of the variation is random, and so lower is better.
- Standard error - this is derived from the error ratio, and is a measure of how much random variation there is in each test grade. So, if the Standard error is 10%, and a student scored 60%, then their real ability probably lies somewhere between 50% and 70%.

Quiz structure analysis
This section lists all the questions in the quiz with various statistics in a table format.
- Q# - shows the question number (position), question type icon, and preview and edit icons
- Question name - the name is also a link to the detailed analysis of this question (See Quiz Question Statistics below).
- Attempts - how many students attempted this question.
- Facility Index - the percentage of students that answered the question correctly.
- Standard Deviation - how much variation there was in the scores for this question.
- Random guess score - the score the student would get by guessing randomly
- Intended/Effective weight - Intended weight is simply what you set up when editing the quiz. If question 1 is worth 3 marks out of a total of 10 for the quiz, the intended weight is 30%. The effective weight is an attempt to estimate, from the results, how much of the actual variation was due to this question. So, ideally the effective weights should be close to the intended weights.
- Discrimination index - this is the correlation between the score for this question and the score for the whole quiz. That is, for a good question, you hope that the students who score highly on this question are the same students who score highly on the whole quiz. Higher numbers are better.
- Discriminative efficiency - another measure that is similar to Discrimination index.
- Where random questions are used, there is one row in the table for the random question, followed by further rows, one for each real question that was selected in place of this random question.
- When quiz questions are randomized for each quiz, the quiz module determines a default position.
- Quiz statistics calculations gives further details on all these quantities.

Quiz statistics chart

Quiz question statistics
Navigation > quiz's name > Results > Statistics (click on any question title) It is possible to see the statistics for one question on a single page. This view will also tell you what percentage of quiz takers selected each answer (Analysis of responses) and give you basic information about the question.
- Question information- The basic information about the question, the name of the quiz, the question, the question type, the position in the quiz and the question itself. There are preview and edit icons in this page.
- Question statistics - This repeats the information from the table row from the Quiz structure analysis that relates to this question.
- Report options - You can choose whether to run the report on all attempts, or just the first attempt by each student. Some of the calculations used in the report are based on assumptions that may not apply to quizzes that allow more than one attempt.
:Tip: Computing the statistics takes some time, the report will store the computed values and re-use them for up to 15 minutes. Therefore, there is a display of how recently the statistics were calculated, with a button to recalculate them immediate
-
 Individual question page preferences
 -
 Individual question's information
 -
 Individual question's statistic information

Analysis of individual question responses
This gives a frequency analysis of the different responses that were given to each part of the question. The details of the analysis depends on the question type, and not all question types support this. For example, essay question responses cannot be analysed.
