mod/techproject/view/screens/gantt
The Gantt View
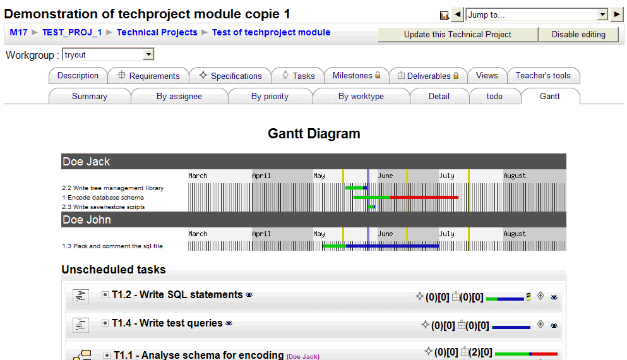
All scheduled tasks can be viewed on a global planning map, called Gantt chart, in which tasks are graphically plotted into a calendar grid.
A task is reasonabily scheduled if its start and end date are enabled and have consistent values.
The Gantt chart groups tasks by assignee and uses an ordering by start date.
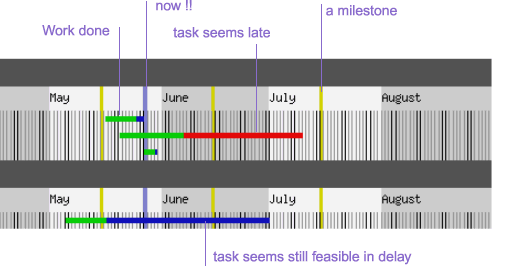
The chart displays dated milestone locations as yellow vertical bars. The actual date (now !!) is displayed as a light blue vertical bar.
Task Bar Details
Tasks tracks are active, and link to the detail view of the relevant object, from wich edition is accessible in we are in editing mode.
Task bars shows graphically the amount of completion (done indicator). The right side of the bar will display the relative "work still to do", as a blue bar if task is not worklate, or red if lateness alarm has raised for this task.
Task Lateness
We call "task lateness" an indicator that results of the comparison of the rate of work that is said to be done, and the rate of effective time spent over planned time.

