admin/setting/blocksettinggismo
| admin/setting/blocksettinggismo | |
|---|---|
| Type | Block, GISMO |
| Downloads | https://moodle.org/plugins/view.php?plugin=block_gismo |
| Issues | https://sourceforge.net/p/gismo/tickets/ |
| Discussion | https://sourceforge.net/p/gismo/code/ci/master/tree/ |
| Maintainer(s) | Christian Milani |
Introduction
You are the instructor of one or more courses given at distance or in a blended learning scenario with the Moodle Course Management System. Maybe your students are hundreds of kilometers away or maybe your students are local, but you see them in classroom only once or twice per semester. Or maybe you opened a Moodle course with further reading and training materials accompanying your lessons. As you are the instructor of your course, you probably want to know what is happening to your students: Are they reading the course-materials? Are they regularly accessing the course? Are there quizzes or assignments particularly problematic? Are their submissions performed in due time?
If this is your case, GISMO can help you. GISMO is a graphical interactive student monitoring and tracking system tool that extracts tracking data from the Moodle Course Management System. It generates also useful graphical representations that can be explored by course instructors to get an overview of the learning activities of the students.
Administrators and study program managers can also use GISMO. They will see the same information as the instructor of the course. For more information about the monitoring of the courses they can also use the MOCLog Dashboard (see Manual MOCLog for administrators and study program managers).
GISMO TOOL OVERVIEW
How to install GISMO in Moodle
To install the software (GISMO block) you need to ask the administrator of your local Moodle platform. Please have a look at the privacy recommendation of MOCLog before installing the plugin.
The GISMO application can be downloaded from the Internet at the following address: http://sourceforge.net/projects/gismo/. Once your administrator has installed the software, you are ready to use it.
Starting GISMO
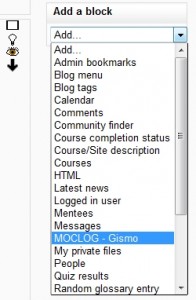
GISMO appears like any other Moodle’s block. You need to turn on the editing modality and add GISMO to your course. Choose in the dropdown list of “Add a block” the menu item „MOCLOG – Gismo“. This block is visible only to the instructor(s) of the course.
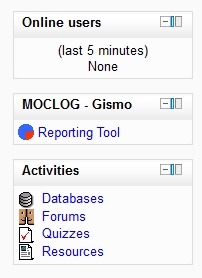
Then you can click on the “Reporting Tool” link that appears within the MOCLOG – Gismo block to start the application.
Wellcome page
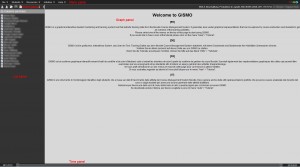
The figure represents the first page of GISMO. As you can see, there are six different areas:
   Graph Panel: Graphs are drawn on this panel.
   List Panel: contains a list of students, resources, assignments, forums and quizzes of the course. For each list you can select/deselect data to visualize.
   Time Panel: Using this panel you can reduce the selection on time and restrict the graph to a specific range of dates.
   Menu Panel: There are five menu items in the bar: File, Students, Resources, Activities and Help. We will illustrate each of them in the next chapter.
   In the menu File you can access the “Options”, the possibility to “Export chart as image” and “Exit” Gismo.
   In the menu Help you can access the “Short overview”, the “Tutorials” and some information “About Gismo”.
   Icons Panel: By clicking on these items, you can list the students, teachers, resources, assignments, forums and quizzes. You can save the graphs as images by clicking on the disc-icon.
   General Panel: information in which course you are right now.
Representation in graphs
In GISMO the following information can be combined to form a two-dimensional graphical representation of the information:
- Students (only for instructors)
- Resources (= Moodle terminology)
- Activities (= Moodle terminology)
- Number of accesses
- Grades of graded activitiesn
- Date / time
The first three information are accessible via the menus, the last three dimensions are added as second axis. Time is always displayed on the X-axis, number of accesses always in the Y-axis. The grades are represented and encoded by the colour of the data point. In most of the diagrams detailed information of a data point is visible using the “mouseover”.
Interpretation of the evaluations
In this chapter we want to show the graphs of the menus Students, Resources, Activities and give some hints for interpreting them. Students
In the menu Students you will find three submenus listed:
- Accesses by students
In the chart of this submenu you will get the information if and when the students accessed the course on each date of a given time period.
- Accesses overview
Here you will get the information of the global number of accesses to the course made by all students in the class on each date of a given time period.
- Accesses overview on resources
The graph in this submenu represents the global number of accesses made by single students to all the resources of the course.
Single students’ accesses on a date
Menu: Students > Accesses by students
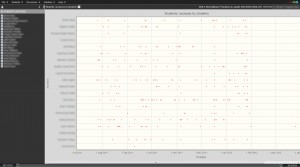
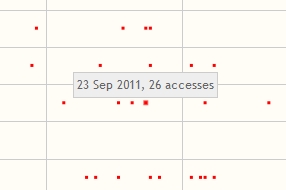
The figure reports an overview on the students’ accesses in the course. A simple matrix formed by students` names (on Y-axis) and dates of the course (on X-axis) is used to represent the course accesses. A corresponding mark represents at least one access to the course made by the student on the selected date. In this example you see that all students (except one) were regularly online present in the course. You can deselect one or more students in the list panel to show the graph of only some of the students.
Remark: Mouseover In all graphs you get additional detail information with “mouseover”.
Number of students accesses on a date
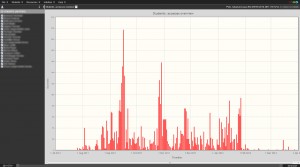
Menu: Students > Accesses overview
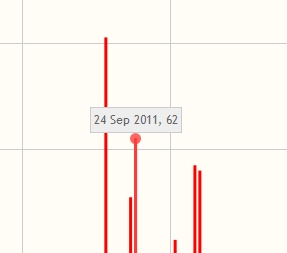
The figure reports a histogram that shows the global number of hits to the course made by students on each date. With the previous graph you have an overview of the global accesses made by students to the course with an identification of patterns and trends. The course in the example was accessed by the students more regularly at the beginning of the course and more frequently than at the end. Other examples show that students access the course more often at the end when the date of the exam is getting closer. You can select/deselect one or more students in the list panel to show the graph with the accesses overview of only some of the students. By moving the mouse over one bar in the histogram, you see the detail information: date of the access and how many accesses the students have done on this date.
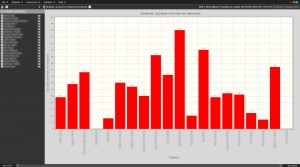
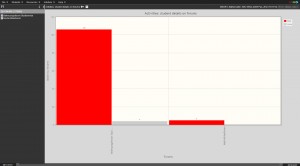
Number of accesses on resources of single students Menu: Students > Accesses overview on resources
The image represents the global number of accesses (in Y-axis) made by the students (Y-axis). In this example four students accessed only a few resources, the other ones opened the resources more frequently.
If you click on the “eye icon” in the list panel, you can see the details for a specific student. This leads to the following representation.
Accesses on resources of a single student on a date Menu: Students > Student details on resources
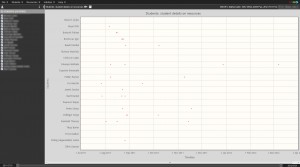
The figure reports an overview of the accesses of one student on the course’s resources. Dates are represented on the X-axis; resources are represented on the Y-axis. The student in the example accessed most of the resources at the end of the course.
By clicking on the arrow in the icons panel on the top of the site, you go back to the previous view showing all students in the list panel.
Resources
In the menu “Resources” you will find two submenus listed:
   Students overview
   In this submenu you will get the information, how many times each student has accessed the resources.
   Accesses overview
   Here you will see the global number of accesses made by the students to each resource of the course.
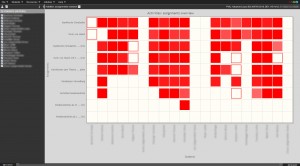
Overview resources of single students Menu: Resources > Students overview
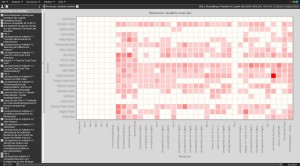
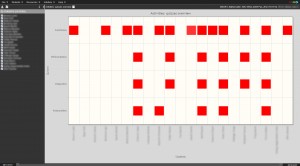
You, as instructor, could also be interested in having the details on which resources were accessed by all the students and when. The figure reports student names on the Y-axis, and resource names on the X-axis. A square is depicted if the student accessed this resource, and the color of the mark ranges from light-red to dark-red according to the number of times he/she accessed this resource. In this example a few students didn’t access any resource or only some of them. There are some students that opened almost all materials online. One student accessed one resource multiple times (dark red).
By clicking on the icon “Show users list” in the icon panel, you will see the students. You can select/deselect one or more students in the list panel to show the chart of only some of them.
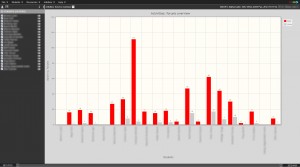
Number of accesses on single resources Menu: Resources > Accesses overview
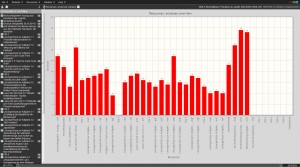
The figure represents the global number (figure on the top of the bar) of accesses made by students to each resource of the course (X-axis). Each bar of the diagram represents a particular resource of the course. The resources at the end of the course were accessed a lot of times. In this case these were files for preparing the final exam. If you click on the “eye icon” in the left menu you can see the details for a specific resource. This leads to the following representation.
Accesses of a student on a single resource on a date Menu: Resources > Resource details on students
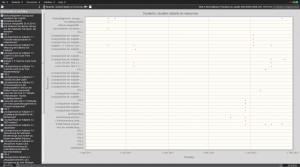
The figure reports an overview of the accesses of students to this particular resource. Dates are represented on the X-axis; students are represented on the Y-axis. The resource in the example was accessed mostly at the beginning of the course by some of the students. There are also students who never opened it. By moving the mouse over one point in the graph, you see the detail information: date of the access and how many times the student has accessed on this date.
Activities
In the menu “Activities” you will find maximum four submenus listed, depends on the activities that are available in the course:
   Assignments
   The chart of this submenu will show you which student solved which assignment and what grade he received.
   Forums
   Here you will see the activities in the forums of the course and how many times students read and wrote a post or a thread.
   Forums over time
   The graph of this submenu represents the global number of contributions to forums over a time period.
   Quizzes
   The chart of this submenu will show you which student solved which quiz and what grade he received.
Overview activities in assignments of single students
Menu: Activities > Assignments
The graph is indented to visually indicate the grades received by students on assignments. On the Y-axis you see the assignments and on the X-axis the students. An empty square means a submission not graded, while a coloured square reports the grade: a lower grade is depicted with a light colour; a high grade is depicted with a dark colour. In this example no student solved the last assignment and only four students didn’t do any assignment.
Overview actions in forums of single students
Menu: Activities > Forums
The figure represents an overview of the action “read” and “write” in the forums of the course. Students are represented on the X-axis; actions on forums are represented on the Y-axis. The overview in the example shows that one student accessed/read a lot of posts and more than the half of the students wrote posts or threads in the forums. If you click on the “eye icon” in the list panel, you can see the details for a specific student. This leads to the following representation.
Actions in forums of a single student Menu: Activities > Student details on forums
In the figure you see in the list panel the forums of the course: In this example there are two forums. This student has read or accessed five times one or more threads in the “Nachrichtenforum”. In the other forum he accessed 106 times the postings in the forum and wrote only four postings.
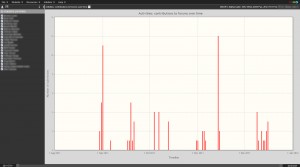
Number of contributions in forums over time period
Menu: Activities > Forums over time
The graph reports an overview of the number of contributions of the students in the forums over time. In this example you see that the students accessed and wrote the first postings and threads in September. During the semester they accessed more or less regularly the postings. You can select/deselect one or more students in the list panel to show the graph of only some of the students.
Overview activities in quizzes of single students
Menu: Activities > Quizzes
The graph represents the students on the X-axis; and the quizzes on the Y-axis. By moving the mouse over one square in the graph, you see the grade of the student. In this example eight students didn’t solve any quiz. The first quiz in the chart was solved by almost all students (except the eight students). Special topics
GISMO uses the students’ log data from Moodle and needs to extract and compute some computation on regular basis. The purpose of this computation is to extract data from logs and derive aggregated information. This computation is done daily by a script that, depending on the setting of your Moodle cron script, runs for example during the night between 02.00 and 04.00 (server time).
GISMO requires some additional database tables that store users’ data. These tables are automatically added to the Moodle database once the administrator launches the Moodle admin page after installing the files.
The export_data.php script
This script can be run from a web browser using the following form of URL:
http://site.example.com/blocks/gismo/lib/gismo/server_side/export_data.php
Result of running the export_data.php script
If everything went OK
