Setting up xhprof on Moodle: Difference between revisions
| Line 14: | Line 14: | ||
sudo make install | sudo make install | ||
</code> | </code> | ||
Note: The version downloaded via these instructions is not compatible with PHP 5.4 - instead you should download the latest version of the code from https://github.com/facebook/xhprof (before following the instructions from 'cd xhprof-0.9.2/extension/' onwards). | |||
Add the following to the apache version of you php.ini file | Add the following to the apache version of you php.ini file | ||
Revision as of 09:37, 18 February 2013
The following instructions are for setting up xhprof for Moodle under a Ubuntu/Debian environment. The process should be similar for other linux enviroments, but will need some tweaking if you wish to do this under windows. Please update this document if you find any major problems.
Installing xhprof
mkdir ~/src/
cd ~/src/
wget http://pecl.php.net/get/xhprof-0.9.2.tgz
tar xvf xhprof-0.9.2.tgz
cd xhprof-0.9.2/extension/
phpize
./configure
make
sudo make install
Note: The version downloaded via these instructions is not compatible with PHP 5.4 - instead you should download the latest version of the code from https://github.com/facebook/xhprof (before following the instructions from 'cd xhprof-0.9.2/extension/' onwards).
Add the following to the apache version of you php.ini file
[xhprof]
extension=xhprof.so
xhprof.output_dir="/var/tmp/xhprof"
Restart Apache
sudo service apache2 restart
Create a file in your web root that makes a call to phpinfo(); and then view the result in your browser to make sure that xhprof is enabled in PHP. Checking the output of php -m would also work if you are sure that the command line version of PHP uses the same php.ini file as your web server.
Configuring Moodle to use xhprof
Once the xhprof php extension is correctly installed you will find a new "Profiling" option available under Settings > Site administration > Development
When you load the profiling settings page you are confronted with several options. In order to get xhprof up and running with minimal fuss you mearly need to check the "Enable profiling" box and set a path that you wish to be profiled. You can simply set this to a wildcard using the asterisk symbol (*) while you are testing profiling. Afterwards you can come back and set this to a more restrictive setting once you know profiling is working. Note the paths need to be specified relative to your Moodle directory and not the web root.
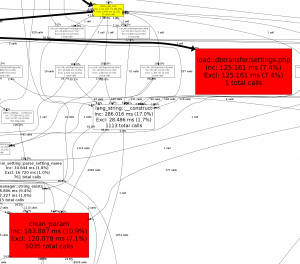
After you have enabled profiling you should load some pages within the "Profile these" filter that you set in the step above. Once you have done these go to Settings > Site administration > Development > Profiling runs and you should see a list of the pages you visited. Clicking on one of these and then clicking on the "View profiling details" will take you to a profiling table full of helpful stats for tracking down slow pages and functions. You can get an even more ineresting breakdown of this by then clicking on the "View Full Callgraph" link. This callgraph makes it easy to see where the slow parts of each particular run are and functions which individually may not take a long time to run but which are run thousands of times and thus resulting in a great deal of slowdown.


