Debugging network requests in the Moodle App: Difference between revisions
sam marshall (talk | contribs) No edit summary |
Juan Leyva (talk | contribs) No edit summary |
||
| Line 30: | Line 30: | ||
Debugging the mobile app is not so easy, so we have provided an online web version of the app that can be easily debugged using the Chrome browser. | Debugging the mobile app is not so easy, so we have provided an online web version of the app that can be easily debugged using the Chrome browser. | ||
# Open your Chrome browser and go to https:// | # Open your Chrome browser and go to https://mobileapp.moodledemo.net/ | ||
# Open your browser options (icon at the top-right of your browser window), then go to More tools -> Developer tools | # Open your browser options (icon at the top-right of your browser window), then go to More tools -> Developer tools | ||
# Dock the new panels on the right side (in the new panel top-right options choose “Dock to the right” icon) | # Dock the new panels on the right side (in the new panel top-right options choose “Dock to the right” icon) | ||
Revision as of 12:50, 16 August 2018
Introduction
This guide will help you find and report problems with the Moodle Mobile app on your site.
It is especially useful for the following problems:
- Unable to log in on your site
- When you receive one of the following error messages in the app:
- Can not find data record in database table external_functions
- Invalid response value detected
- Cannot get course contents
Requirements
- Moodle 3.0 onwards (your site needs at least this version)
- Google Chrome or Chromium browser
Enabling debugging on your Moodle site
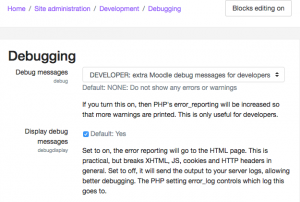
- Go to Debugging in the Site administration
- For "Debug messages" select 'DEVELOPER'
- Tick "Display debug messages"
- Click the 'Save changes' button.
Note: Remember to disable debugging again once you have finished debugging your problem.
Setting up Chrome
Debugging the mobile app is not so easy, so we have provided an online web version of the app that can be easily debugged using the Chrome browser.
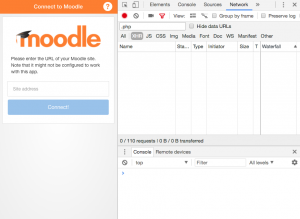
- Open your Chrome browser and go to https://mobileapp.moodledemo.net/
- Open your browser options (icon at the top-right of your browser window), then go to More tools -> Developer tools
- Dock the new panels on the right side (in the new panel top-right options choose “Dock to the right” icon)
- Click the Network tab (at the top-center)
- Enable the filter (filter shape icon) so it changes to colour red
- In the new text field displayed when enabling the filter write
.php
Now you are ready to debug all the web services requests sent to your Moodle site by the mobile app.
Debugging a web service (WS) error
- Connect to your site and browse to the functionality displaying an error
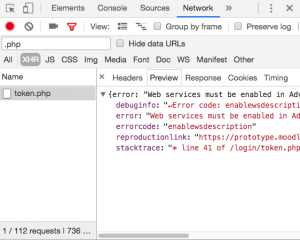
- In the right panel you will see a list of requests made by the app to your Moodle site (token.php server.php server.php etc..)
- Click on each one of them (starting with the last one in the list) but skip those that don’t start with token.php or server.php
- In the new sub-window open select the “Response” tab and check if you see an error
- Copy the error then go to the en:Moodle Mobile FAQ Moodle Mobile FAQ in the user docs to check if there is a known solution for it
- If you are unable to find a solution, post in the Moodle for mobile forum on moodle.org
Building Moodle Desktop with devtools enabled
You may be using some features, such as Single Sign-On, that require a built app to work, rather than a hosted or local ionic build running in a web browser. In this case, you can build the Moodle Desktop app with the browser's developer tools enabled.
- Ensure you have a working app development environment
- In your terminal of choice, go to the directory where you have the app's code.
- Edit desktop/electron.js. Around line 66 (at the end of the createWindow() function, but inside the function), add the line:
mainWindow.webContents.openDevTools();
It should look something like:mainWindow.on('focus', () => { mainWindow.webContents.send('coreAppFocused'); // Send an event to the main window. }); mainWindow.webContents.openDevTools(); } - Run
npm install -g electron electron-builder - Windows only: Run
npm install electron-builder-squirrel-windows app-builder-lib @nodert-win10-au/windows.data.xml.dom - Compile the code:
ionic build - Run
npm run desktop.pack
This should give you a build of the app in desktop/dist. For example, in windows you can run desktop/dist/win-unpacked/Moodle Desktop.exe. In MacOS you can run desktop/dist/mac/Moodle Desktop.app.
When the app starts, the browser devtools will run inside the app, allowing you to inspect and debug the pages. If you close the tools, you will have to restart the app to open them again.


