Charts API: Difference between revisions
mNo edit summary |
David Mudrak (talk | contribs) m (Text replacement - "</code>" to "</syntaxhighlight>") |
||
| Line 18: | Line 18: | ||
$chart->set_labels($labels); | $chart->set_labels($labels); | ||
echo $OUTPUT->render($chart); | echo $OUTPUT->render($chart); | ||
</ | </syntaxhighlight> | ||
Example: | Example: | ||
| Line 35: | Line 35: | ||
$chart->set_labels($labels); | $chart->set_labels($labels); | ||
echo $OUTPUT->render($chart); | echo $OUTPUT->render($chart); | ||
</ | </syntaxhighlight> | ||
Example: | Example: | ||
| Line 50: | Line 50: | ||
$chart->set_labels($labels); | $chart->set_labels($labels); | ||
echo $OUTPUT->render($chart); | echo $OUTPUT->render($chart); | ||
</ | </syntaxhighlight> | ||
Example: | Example: | ||
| Line 64: | Line 64: | ||
$chart->set_labels($labels); | $chart->set_labels($labels); | ||
echo $OUTPUT->render($chart); | echo $OUTPUT->render($chart); | ||
</ | </syntaxhighlight> | ||
Example: | Example: | ||
| Line 79: | Line 79: | ||
$chart->set_labels($labels); | $chart->set_labels($labels); | ||
echo $OUTPUT->render($chart); | echo $OUTPUT->render($chart); | ||
</ | </syntaxhighlight> | ||
Example: | Example: | ||
| Line 92: | Line 92: | ||
$chart->set_labels($labels); | $chart->set_labels($labels); | ||
echo $OUTPUT->render($chart); | echo $OUTPUT->render($chart); | ||
</ | </syntaxhighlight> | ||
Example: | Example: | ||
| Line 106: | Line 106: | ||
$chart->set_labels($labels); | $chart->set_labels($labels); | ||
echo $OUTPUT->render($chart); | echo $OUTPUT->render($chart); | ||
</ | </syntaxhighlight> | ||
Example: | Example: | ||
| Line 118: | Line 118: | ||
<code php> | <code php> | ||
$serie1 = new core\chart_series('My series title', [400, 460, 1120, 540]); | $serie1 = new core\chart_series('My series title', [400, 460, 1120, 540]); | ||
</ | </syntaxhighlight> | ||
== Properties == | == Properties == | ||
| Line 126: | Line 126: | ||
<code php> | <code php> | ||
$chart->set_title('chart with a title'); | $chart->set_title('chart with a title'); | ||
</ | </syntaxhighlight> | ||
=== Labels === | === Labels === | ||
| Line 132: | Line 132: | ||
<code php> | <code php> | ||
$chart->set_labels(['2004', '2005', '2006', '2007']); | $chart->set_labels(['2004', '2005', '2006', '2007']); | ||
</ | </syntaxhighlight> | ||
== Axis == | == Axis == | ||
| Line 141: | Line 141: | ||
$xaxis = $chart->get_xaxis(0, true) // Select the index 0 of X axis and pass true to create the axis if not exists. | $xaxis = $chart->get_xaxis(0, true) // Select the index 0 of X axis and pass true to create the axis if not exists. | ||
$yaxis = $chart->get_yaxis(0, true) // Select the index 0 of Y axis and pass true to create the axis if not exists. | $yaxis = $chart->get_yaxis(0, true) // Select the index 0 of Y axis and pass true to create the axis if not exists. | ||
</ | </syntaxhighlight> | ||
Once you get the axis you want change, you can change the attributes you need. | Once you get the axis you want change, you can change the attributes you need. | ||
It is also possible to select multiple axis, for example if you want to have custom steps labels in one side and data in the other. | It is also possible to select multiple axis, for example if you want to have custom steps labels in one side and data in the other. | ||
| Line 150: | Line 150: | ||
$yaxis2 = $chart->get_yaxis(1, true) // Select the second Y axis. | $yaxis2 = $chart->get_yaxis(1, true) // Select the second Y axis. | ||
$yaxis2->set_position(chart_axis::POS_RIGHT); // Now I can change positioning, labels and etc just on the right side. | $yaxis2->set_position(chart_axis::POS_RIGHT); // Now I can change positioning, labels and etc just on the right side. | ||
</ | </syntaxhighlight> | ||
=== Axis title === | === Axis title === | ||
| Line 158: | Line 158: | ||
$chart->get_xaxis(0, true)->set_label("I'm the label for X"); | $chart->get_xaxis(0, true)->set_label("I'm the label for X"); | ||
$chart->get_yaxis(0, true)->set_label("I'm the label for Y"); | $chart->get_yaxis(0, true)->set_label("I'm the label for Y"); | ||
</ | </syntaxhighlight> | ||
=== Axis position === | === Axis position === | ||
| Line 175: | Line 175: | ||
$yaxis->set_position(chart_axis::POS_RIGHT); // You can use POS_LEFT or POS_RIGHT for Y axis, in this case let's change the position to the right side. | $yaxis->set_position(chart_axis::POS_RIGHT); // You can use POS_LEFT or POS_RIGHT for Y axis, in this case let's change the position to the right side. | ||
$chart->set_yaxis($yaxis); | $chart->set_yaxis($yaxis); | ||
</ | </syntaxhighlight> | ||
=== Step size === | === Step size === | ||
| Line 185: | Line 185: | ||
$xaxis = new chart_axis(); | $xaxis = new chart_axis(); | ||
$axis->set_stepsize(5); // Chart steps will be displayed as 5, 10, 15, 20... | $axis->set_stepsize(5); // Chart steps will be displayed as 5, 10, 15, 20... | ||
</ | </syntaxhighlight> | ||
=== Step labels === | === Step labels === | ||
| Line 193: | Line 193: | ||
$chart->get_xaxis(0, true); | $chart->get_xaxis(0, true); | ||
$chart->get_xaxis(1, true)->set_labels(['Poor', 'Average', 'Good', 'Perfect']); | $chart->get_xaxis(1, true)->set_labels(['Poor', 'Average', 'Good', 'Perfect']); | ||
</ | </syntaxhighlight> | ||
=== Min and Max === | === Min and Max === | ||
| Line 202: | Line 202: | ||
$xaxis->set_min(1); | $xaxis->set_min(1); | ||
$xaxis->set_max(100); | $xaxis->set_max(100); | ||
</ | </syntaxhighlight> | ||
== Mixed chart types == | == Mixed chart types == | ||
| Line 214: | Line 214: | ||
$chart->add_series($series1); | $chart->add_series($series1); | ||
$chart->set_labels(['2004', '2005', '2006', '2007']); | $chart->set_labels(['2004', '2005', '2006', '2007']); | ||
</ | </syntaxhighlight> | ||
Please note the order you call add_series change the order series are displayed on the chart. In the example above, the first to be displayed will be line chart and in the background the bar chart. | Please note the order you call add_series change the order series are displayed on the chart. In the example above, the first to be displayed will be line chart and in the background the bar chart. | ||
| Line 225: | Line 225: | ||
<code php> | <code php> | ||
echo $OUTPUT->render($chart); | echo $OUTPUT->render($chart); | ||
</ | </syntaxhighlight> | ||
=== Show chart data table === | === Show chart data table === | ||
| Line 233: | Line 233: | ||
<code php> | <code php> | ||
echo $OUTPUT->render_chart($chart, false); | echo $OUTPUT->render_chart($chart, false); | ||
</ | </syntaxhighlight> | ||
=== Overriding chart colours === | === Overriding chart colours === | ||
| Line 239: | Line 239: | ||
<code php> | <code php> | ||
$CFG->chart_colorset = ['#001f3f', '#01ff70', '#F012BE', '#85144b', '#B10DC9']; | $CFG->chart_colorset = ['#001f3f', '#01ff70', '#F012BE', '#85144b', '#B10DC9']; | ||
</ | </syntaxhighlight> | ||
=== Legend options === | === Legend options === | ||
| Line 247: | Line 247: | ||
$chart->set_legend_options(['display' => false]); // Hide chart legend. | $chart->set_legend_options(['display' => false]); // Hide chart legend. | ||
$chart->set_legend_options(['position' => 'left']); // Change legend position to left side. | $chart->set_legend_options(['position' => 'left']); // Change legend position to left side. | ||
</ | </syntaxhighlight> | ||
=== RTL === | === RTL === | ||
| Line 254: | Line 254: | ||
<code PHP> | <code PHP> | ||
echo html_writer::tag('div', $OUTPUT->render($chart), ['dir' => 'ltr']); | echo html_writer::tag('div', $OUTPUT->render($chart), ['dir' => 'ltr']); | ||
</ | </syntaxhighlight> | ||
Revision as of 13:02, 14 July 2021
Moodle 3.2
Overview
The Charts API is a core set of methods intended to provide a simple and yet modern interface to generate dynamic charts.
Chart types
The first step to create a new chart is to create an instance of the desired chart type. At the moment bar, line and pie types are supported and using some display changing methods can change how the charts are displayed.
Bar
To create a new bar chart, just create a new instance of chart_bar class.
$chart = new core\chart_bar();
$chart->add_series($sales);
$chart->add_series($expenses);
$chart->set_labels($labels);
echo $OUTPUT->render($chart);
</syntaxhighlight>
Example:

You might want change how your bar chart are displayed:
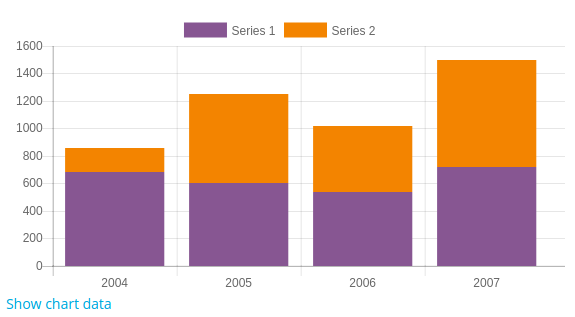
Stacked Bar
To display stacked bars, you can call set_stacked() method, setting the parameter to true.

$chart = new core\chart_bar();
$chart->set_stacked(true);
$chart->add_series($sales);
$chart->add_series($expenses);
$chart->set_labels($labels);
echo $OUTPUT->render($chart);
</syntaxhighlight>
Example:

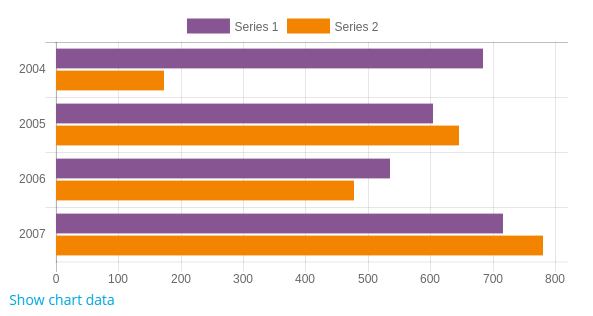
Horizontal Bar
To display you bar chart in the horizontal position, you need to call set_horizontal():

$chart = new core\chart_bar();
$chart->set_horizontal(true); // Calling set_horizontal() passing true as parameter will display horizontal bar charts.
$chart->add_series($sales);
$chart->add_series($expenses);
$chart->set_labels($labels);
echo $OUTPUT->render($chart);
</syntaxhighlight>
Example:

Line
To create a new line chart, just create an instance of chart_line class. By default, lines are tensioned.

$chart = new \core\chart_line();
$chart->add_series($sales);
$chart->add_series($expenses);
$chart->set_labels($labels);
echo $OUTPUT->render($chart);
</syntaxhighlight>
Example:

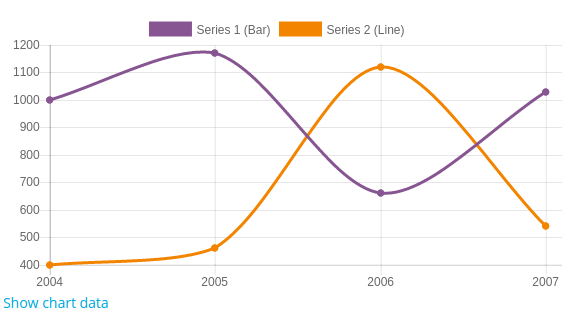
Smooth lines
You might want to change you line chart to display smooth lines:

$chart = new \core\chart_line();
$chart->set_smooth(true); // Calling set_smooth() passing true as parameter, will display smooth lines.
$chart->add_series($sales);
$chart->add_series($expenses);
$chart->set_labels($labels);
echo $OUTPUT->render($chart);
</syntaxhighlight>
Example:

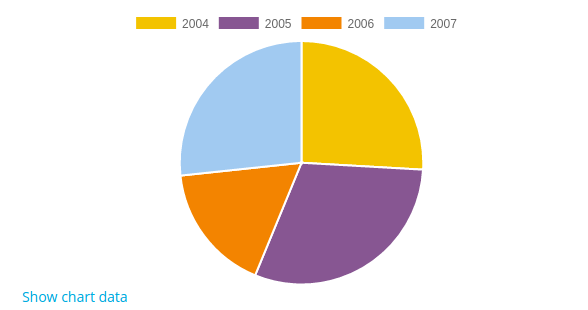
Pie
To create a pie chart you just need to create a new instance of chart_pie class.

$chart = new \core\chart_pie();
$chart->add_series($sales); // On pie charts we just need to set one series.
$chart->set_labels($labels);
echo $OUTPUT->render($chart);
</syntaxhighlight>
Example:

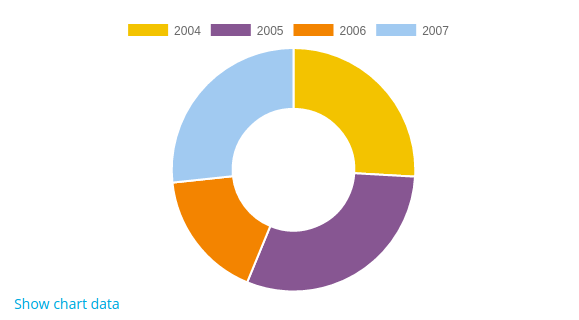
Doughnut
You might want to change you pie chart to be displayed as doughnut:

$chart = new \core\chart_pie();
$chart->set_doughnut(true); // Calling set_doughnut(true) we display the chart as a doughnut.
$chart->add_series($sales);
$chart->set_labels($labels);
echo $OUTPUT->render($chart);
</syntaxhighlight>
Example:

Series
Series can be defined as a set of values. To set series of a chart, you need to create an instance of chart_series object and pass the title and an array of values.
The title and the data are displayed when mouse over the specific point representing the serie on the chart.
The number of values of the series must be equal to the number of labels.

$serie1 = new core\chart_series('My series title', [400, 460, 1120, 540]);
</syntaxhighlight>
Properties
Title
It is possible to set a chart title, by calling set_title and passing the title as string method.

$chart->set_title('chart with a title');
</syntaxhighlight>
Labels
Labels are the description in which the data will be grouped, in the example above labels are an array of years. The number of values on the series must match the number of labels.

$chart->set_labels(['2004', '2005', '2006', '2007']);
</syntaxhighlight>
Axis
You can customise chart axis (X,Y) by setting title, position and change the step size.
Firstly, you need to select the axis by the side you want and providing the index and whether you want to create the axis if it does not exists.

$chart = new chart_line();
$xaxis = $chart->get_xaxis(0, true) // Select the index 0 of X axis and pass true to create the axis if not exists.
$yaxis = $chart->get_yaxis(0, true) // Select the index 0 of Y axis and pass true to create the axis if not exists.
</syntaxhighlight>
Once you get the axis you want change, you can change the attributes you need.
It is also possible to select multiple axis, for example if you want to have custom steps labels in one side and data in the other.

$chart = new chart_line();
$xaxis1 = $chart->get_xaxis(0, true) // Select the index 0 of X axis and pass true to create the axis if not exists.
$yaxis1 = $chart->get_yaxis(0, true) // Will display the default axis steps information.
$yaxis2 = $chart->get_yaxis(1, true) // Select the second Y axis.
$yaxis2->set_position(chart_axis::POS_RIGHT); // Now I can change positioning, labels and etc just on the right side.
</syntaxhighlight>
Axis title
Axis titles can be displayed on the chart sides and can be used to provide additional information about the chart.

$chart = new chart_line();
$chart->get_xaxis(0, true)->set_label("I'm the label for X");
$chart->get_yaxis(0, true)->set_label("I'm the label for Y");
</syntaxhighlight>
Axis position
You can define the position of axis by calling set_position() and passing the axis position constant (POS_RIGHT, POS_LEFT, POS_BOTTOM, POS_TOP).

$chart = new chart_line();
// Customise X axis.
$xaxis = new chart_axis();
$xaxis->set_label("I'm X, but at the top");
$xaxis->set_position(chart_axis::POS_TOP); // You can use POS_BOTTOM or POS_TOP for X axis, in this case let's change the position to the top.
$chart->set_xaxis($xaxis);
// Customise Y axis.
$yaxis = new chart_axis();
$yaxis->set_position(chart_axis::POS_RIGHT); // You can use POS_LEFT or POS_RIGHT for Y axis, in this case let's change the position to the right side.
$chart->set_yaxis($yaxis);
</syntaxhighlight>
Step size
Step size can be described as the size between the axis labels. You can set the step size of the axis, by calling set_stepsize() and passing the step size number.

$chart = new chart_line();
// Customise X axis.
$xaxis = new chart_axis();
$axis->set_stepsize(5); // Chart steps will be displayed as 5, 10, 15, 20...
</syntaxhighlight>
Step labels
If you prefer to display custom labels instead of numbers, just get the axis and call set_labels passing an array of labels:

$chart = new chart_line();
$chart->get_xaxis(0, true);
$chart->get_xaxis(1, true)->set_labels(['Poor', 'Average', 'Good', 'Perfect']);
</syntaxhighlight>
Min and Max
You can customise the minimum and the maximum value of a axis step size.

$chart = new chart_line();
$xaxis = $chart->get_xaxis(1, true);
$xaxis->set_min(1);
$xaxis->set_max(100);
</syntaxhighlight>
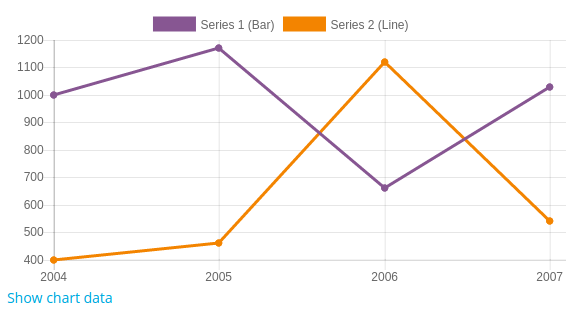
Mixed chart types
It is possible to combine two types of chart by setting the type of the series differently of the chart type. For example, to create a chart that combine a bar chart with a line chart:

$chart = new \core\chart_bar(); // Create a bar chart instance.
$series1 = new \core\chart_series('Series 1 (Bar)', [1000, 1170, 660, 1030]);
$series2 = new \core\chart_series('Series 2 (Line)', [400, 460, 1120, 540]);
$series2->set_type(\core\chart_series::TYPE_LINE); // Set the series type to line chart.
$chart->add_series($series2);
$chart->add_series($series1);
$chart->set_labels(['2004', '2005', '2006', '2007']);
</syntaxhighlight>
Please note the order you call add_series change the order series are displayed on the chart. In the example above, the first to be displayed will be line chart and in the background the bar chart.
Example:


Rendering
All charts are rendered by render_chart() located on outputrenderers.php, once the chart object is ready, it must be passed to render() or render_chart().

echo $OUTPUT->render($chart);
</syntaxhighlight>
Show chart data table
By default, in order to make chart data accessible to users with special needs, a link at the bottom of the chart will display a table containing all of its data.
If that information is already displayed on the page in some other fashion, it may not be necessary to display the chart data table.
To remove it, a false value can be passed as the second parameter when calling the render_chart function:

echo $OUTPUT->render_chart($chart, false);
</syntaxhighlight>
Overriding chart colours
It is possible to override the default set of colours used on charts, you just need to the following setting to config.php and set an array of hex css colours:

$CFG->chart_colorset = ['#001f3f', '#01ff70', '#F012BE', '#85144b', '#B10DC9'];
</syntaxhighlight>
Legend options
It is possible to customize some aspects of the chart legend such position and visibility. In order to do that you need to call set_legend_options() method
and pass an array of options supported by ChartJS.

$chart->set_legend_options(['display' => false]); // Hide chart legend.
$chart->set_legend_options(['position' => 'left']); // Change legend position to left side.
</syntaxhighlight>
RTL
Please note numerical ranges should be displayed in LTR, and not in RTL for both RTL and LTR languages, you can wrap the chart with a container with dir tag.

echo html_writer::tag('div', $OUTPUT->render($chart), ['dir' => 'ltr']);
</syntaxhighlight>