Diferencia entre revisiones de «Reporte de estadísticas de examen»
(Added =====Análisis de respuestas a preguntas aleatorias=====) |
(update as per English 3.5) |
||
| Línea 10: | Línea 10: | ||
Para una introducción general a psicometría, este [http://www.youtube.com/watch?v=F5Lu3EdsXNo&NR=1 seminario de 45-minutos] proporcionaba una introducción muy accesible. | Para una introducción general a psicometría, este [http://www.youtube.com/watch?v=F5Lu3EdsXNo&NR=1 seminario de 45-minutos] proporcionaba una introducción muy accesible. | ||
{{Urgente de traducir}} | |||
===Razones para revisar el reporte de estadísticas=== | |||
There are lots of highly technical in the Quiz statistics, which is great if you are a data scientist or mathematician, but even if you are not, there is very useful information you can learn about how well your quiz is helping your students, even if you don't understand all technicalities. | |||
====Encontrar preguntas 'rotas'==== | |||
If everything is working well, then what normally happens is that students who got a high mark on the whole quiz are more likely to get each question right. If you make a mistake when you create a question, for example if you accidentally set the wrong response to be marked correct. What happens then is that the better students who get a higer overall mark are morelikely to select the right answer, and get marked wrong. This shows up in the 'Discrimination index' column. If the number there is small, you may have a problem. A broken question is not the only thing that might casue this, so you need to go an investiage, but it is a worrying sign. Because of that, Moodle will higlight any low values in this column so they stand out. | |||
'''Tip: look down the 'Discrimination index' column. If any numbers there are small, then investigate that question.''' | |||
If you find a 'broken' question, there are various options. You may be able to edit the question and then regrade the quiz to fix the problem (but be very careful editing questions after they were attempted.) Or, you could to the the Edit quiz page, and set the mark for that question to 0 (zero-weight it). | |||
====Asegurarse de que las variantes aleatorias sean apropiadas==== | |||
There are lots of different ways that randomisation can be used when building a quiz. Sometimes you will have something like a topic reivew quiz that draws a selection of 10 question from a set of 100, but the case we want to consider here is when for each 'question' in the quiz, you have a few different but similar versions of the 'same' question. For formative quizzes that is good, because it gives students more chance to practice. For summative quizzes, it is good because it reduces the changes for copying. You can build this either using random selection from different categories like 'Variants of question 1', or you can do it with question types like [[Calculated_question_type|Calculated] or [https://moodle.org/plugins/qtype_stack STACK] that have internal random variants, or both. ([[Effective_quiz_practices#Robust_testing_with_random_variants|For more details, see here]].) | |||
If you are doing this, particuarly if doing this for-credit, you probably want to ensure that it is 'fair'. You don't want one variant to be much harder than the others. To see this, look at the subsidiary rows that show all the different questions that appered in once particular place in the quiz. Look in particular at the 'Facility index', which is basically how many people got that qustion right. If those numbers are very different for different variants, that is is a sign the quiz may be unfair. | |||
'''Tip: if using variants, look down the 'Facility index' column to make sure that all the different variants of a particular question have similar facility index.''' | |||
If there is big variation in one questions, then you could zero-weight it. Also, if you are re-using the quiz in future, consider removing that variant, and adding a new one. | |||
Of course, when you have variants like this, you should check that Descrimination index for all the different variants, to ensure that none of the variants are broken in that way either. | |||
====Entender como están respondiendo los estudiantes a una pregunta particular==== | |||
When you set a particular question in a quiz, you normally do so intending to test a particular skill or bit of knowledge. However, can you be sure that is what you are really measuring? | |||
As an example from this, there was an Open University 'Maths for Scientists' course, where they had a question which was supposed to test that the student could substitute some numbers in an equation, and computer the answer with their calculator. As is standard practice for OU science tests, students had to give the answer to the right number of decimal places (which had already been taught and assessed). However, when they look at the answers students had given, they found that many students had clearly computed the right thing in their calculator, but were then being marked wrong because they input too many decimal places. ([http://oro.open.ac.uk/39669/ Jordan, 2014) | |||
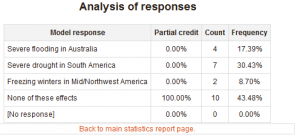
The statistics report makes this kind of anlysis quite easy. As described below, if you click through to the details about a particular question, then at the bottom of that page it shows all the different responses that were given, whether they were marked right or wrong, and how many students gave each results. | |||
This can be a good place to start looking if some of the checks above hilight a potential problem. | |||
Another way you can use this information is, if you are using more open-ended question types, like Short answer or Numerical, then you may notice several students have made the same mistake. You might then go back end edit the question, to add specific feedback for students who have given that answer. | |||
'''Sugerencia: particularmente si Usted está usando preguntas abiertas, revise el Análisis de las respuestas para ver que respuestas están dando realmente los estudiantes.''' | |||
Revisión del 13:39 13 jul 2018
Moodle 2.x
Navegación > Curso > Nombre del examen > Resultados > Estadísticas
| Nota del traductor: En Español internacional "cuestionario" corresponde a "examen" del Español de México como traducción de la palabra inglesa "quiz". |
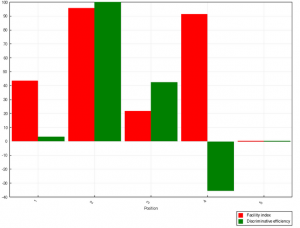
Este reporte da un análisis estadístico (psicométrico) del examen (cuestionario), y de sus preguntas. La parte superior del reporte da un resumen del examen completo. La siguiente sección da un análisis que muestra todas las preguntas en un formato de tabla. Hay ligas en esta sección, para editar preguntas individuales o entrar en un análisis detallado de una pregunta en particular. La última parte de este reporte es una gráfica de barras del porcentaje de respuestas correctas (Índice de Facilidad) y del índice de Eficiencia Discriminatoria.
El reporte completo (vista general, y análisis detallado de todas las preguntas) se puede descargar en una variedad de formatos, al igual que la tabla del anáisis de la estructura del examen.
Para una introducción general a psicometría, este seminario de 45-minutos proporcionaba una introducción muy accesible.
Nota: Urgente de Traducir. ¡ Anímese a traducir esta muy importante página !. ( y otras páginas muy importantes que urge traducir)
Razones para revisar el reporte de estadísticas
There are lots of highly technical in the Quiz statistics, which is great if you are a data scientist or mathematician, but even if you are not, there is very useful information you can learn about how well your quiz is helping your students, even if you don't understand all technicalities.
Encontrar preguntas 'rotas'
If everything is working well, then what normally happens is that students who got a high mark on the whole quiz are more likely to get each question right. If you make a mistake when you create a question, for example if you accidentally set the wrong response to be marked correct. What happens then is that the better students who get a higer overall mark are morelikely to select the right answer, and get marked wrong. This shows up in the 'Discrimination index' column. If the number there is small, you may have a problem. A broken question is not the only thing that might casue this, so you need to go an investiage, but it is a worrying sign. Because of that, Moodle will higlight any low values in this column so they stand out.
Tip: look down the 'Discrimination index' column. If any numbers there are small, then investigate that question.
If you find a 'broken' question, there are various options. You may be able to edit the question and then regrade the quiz to fix the problem (but be very careful editing questions after they were attempted.) Or, you could to the the Edit quiz page, and set the mark for that question to 0 (zero-weight it).
Asegurarse de que las variantes aleatorias sean apropiadas
There are lots of different ways that randomisation can be used when building a quiz. Sometimes you will have something like a topic reivew quiz that draws a selection of 10 question from a set of 100, but the case we want to consider here is when for each 'question' in the quiz, you have a few different but similar versions of the 'same' question. For formative quizzes that is good, because it gives students more chance to practice. For summative quizzes, it is good because it reduces the changes for copying. You can build this either using random selection from different categories like 'Variants of question 1', or you can do it with question types like [[Calculated_question_type|Calculated] or STACK that have internal random variants, or both. (For more details, see here.)
If you are doing this, particuarly if doing this for-credit, you probably want to ensure that it is 'fair'. You don't want one variant to be much harder than the others. To see this, look at the subsidiary rows that show all the different questions that appered in once particular place in the quiz. Look in particular at the 'Facility index', which is basically how many people got that qustion right. If those numbers are very different for different variants, that is is a sign the quiz may be unfair.
Tip: if using variants, look down the 'Facility index' column to make sure that all the different variants of a particular question have similar facility index.
If there is big variation in one questions, then you could zero-weight it. Also, if you are re-using the quiz in future, consider removing that variant, and adding a new one.
Of course, when you have variants like this, you should check that Descrimination index for all the different variants, to ensure that none of the variants are broken in that way either.
Entender como están respondiendo los estudiantes a una pregunta particular
When you set a particular question in a quiz, you normally do so intending to test a particular skill or bit of knowledge. However, can you be sure that is what you are really measuring?
As an example from this, there was an Open University 'Maths for Scientists' course, where they had a question which was supposed to test that the student could substitute some numbers in an equation, and computer the answer with their calculator. As is standard practice for OU science tests, students had to give the answer to the right number of decimal places (which had already been taught and assessed). However, when they look at the answers students had given, they found that many students had clearly computed the right thing in their calculator, but were then being marked wrong because they input too many decimal places. ([http://oro.open.ac.uk/39669/ Jordan, 2014)
The statistics report makes this kind of anlysis quite easy. As described below, if you click through to the details about a particular question, then at the bottom of that page it shows all the different responses that were given, whether they were marked right or wrong, and how many students gave each results.
This can be a good place to start looking if some of the checks above hilight a potential problem.
Another way you can use this information is, if you are using more open-ended question types, like Short answer or Numerical, then you may notice several students have made the same mistake. You might then go back end edit the question, to add specific feedback for students who have given that answer.
Sugerencia: particularmente si Usted está usando preguntas abiertas, revise el Análisis de las respuestas para ver que respuestas están dando realmente los estudiantes.
Estadísticas generales del examen
Aquí están los detalles sobre la información de este reporte robusto.
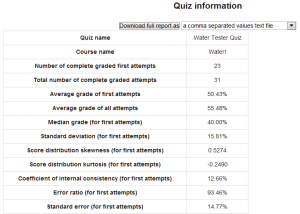
Información del examen
Esta sección proporciona alguna información básica sobre la prueba como un todo. Usted verá:
- Nombre del examen
- Nombre del curso
- Fechas de apertura y cierre (si aplican)
- Número total de intentos (primeros/calificados)
- Calificación promedio para intentos primeros/todos
- Mediana de calificación
- Desviación estándar de calificaciones
- Sesgo y Kurtosis de la distribución de las calificaciones
- Coefficiente de Consistencia interna (en ocasiones llamado Cronbach Alpha) - Esta es una medición de si todos los items en el examen están examinando básicamente la misma cosa. Por lo tanto, mide la consistencia del texto, que es el límite inferior de la validez. Aquí los números mayores son mejores.
- Tasa de error - la variación de las calificaciones viene de dos fuentes. En primer lugar, algunos alumnos son mejores que otros para lo que se les está preguntando, y en segundo lugar existe una variación aleatoria. Nosotros esperamos que las calificaciones del examen estén principalmente determinadas por la habilidad del estudiante, y que se minimice la variación aleatoria. La tasa de error estima cuanta de la variación es aleatoria, por lo que menos es mejor.
- Error estándar - este se deriva de la tasa de error, y es una medida de cuanta variación aleatoria existe en cada calificación del examen. Por lo tanto, si el error estándar es 10%, y un estudiante tuvo calificación de 60%, entonces su habilidad real probablemente esté entre 50% y 70%.
Análisis de la estructura del examen
Esta sección enlista todas las preguntas en el examen con varias estadísticas en un formato de tabla.
- Q# - muestra el número de la pregunta (su posición), ícono del tipo de pregunta, y los íconos de vista previa y edición
- Nombre de la pregunta - el nombre es también una liga al análisis detallado de esta pregunta (vea debajo Estadísticas de la Pregunta).
- Intentos - cuantos estudiantes intentaron esta pregunta.
Índice de facilidad
- Índice de Facilidad - el porcentaje de estudiantes que contestó correctamente la pregunta.
Desviación estándar
- Desviación estándar - cuanto variación había en los puntajes para esta pregunta.
Puntaje por adivinar aleatoriamente
- Puntaje por adivinar aleatoriamente - el puntaje que el estudiante obtendría adivinando aleatoriamente.
Peso Deseado/Efectivo
- Peso Deseado/Efectivo - El peso deseado es simplemente lo que Usted configura cuando edita el examen. Si la pregunta 1 vale 3 puntos de un total de 10 que vale el examen completo, entonces el peso deseado es 30%. El peso efectivo es un intento para estimar, a partir de los resultados, cuanto de la variación real se debió a esta pregunta. Así, idealmente los pesos efectivos deberían estar cercanos a los pesos deseados.
Índice de Discriminación y Eficiencia Discriminatoria
- Índice de Discriminación - esta es la correlación entre el puntaje para esta pregunta y el puntaje para el examen completo. Así, para una buena pregunta, Usted espera que los estudiantes que obtengan un puntaje alto en esta pregunta sean los mismos estudiantes que tengan puntaje alto en el examen completo. Los números mayores son mejores.
- Eficiencia Discriminatoria - otra medida que es similar al Índice de Discriminación.
- Donde se emplean preguntas al azar, existe una fila en la tabla para las preguntas al azar, seguida por otras filas, una para cada pregunta real que fue seleccionada en lugar de la pregunta al azar.
- Donde las preguntas del examen se ordenan aleatoriamente para cada examen, el módulo examen determina una posición por defecto.
Mayores detalles
- Quiz statistics calculations Proporciona mayores detalles sobre cómo se obtienen y qué significan todas estas cantidades.
Gráfica de estadísticas del examen
Estadísticas de Pregunta de examen
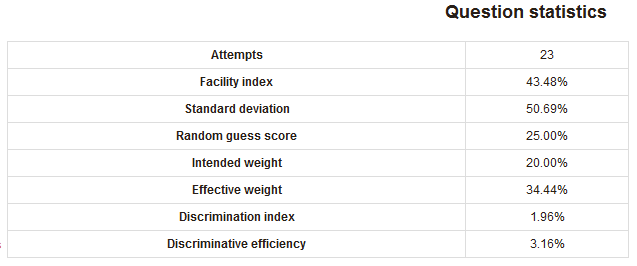
Navigación > nombre del examen > Resultados > Estadísticas (elija cualquier título de pregunta) Es posible ver las estadísticas para una pregunta en una página individual. Esta vista también le dirá qué porcentaje de los examinados seleccionó cada una de las respuestas (Análisis de Respuestas) y le dará información básica sobre la pregunta.
- Información de la Pregunta- La información básica sobre la pregunta, el nombre del examen, la pregunta, el tipo de pregunta, la posición dentro del examen y la pregunta en sí misma. Hay íconos para vista previa y edición en esta página.
- Estadísticas de la pregunta - Esto repite la información de la fila de la tabla del análisis de la estructura del examen que tiene que ver con esta pregunta.
- Opciones del Reporte - Usted puede elegir si quiere correr el reporte sobre todos los intentos, o solamente primeros intentos de cada estudiante. Algunos de los cálculos usados en el reporte están basados en suposiciones que tal vez no apliquen para exámenes en donde se permitió más de un intento para resolverlos.
:Tip: Calcular las estadísticas toma un cierto tiempo, el reporte guardará los valores computados y los re-utilizará por hasta 15 minutos. Por lo tanto, se muestra que tan recientemente se calcularon las estadísticas , con un botón para recalcularlas inmediatamente.
Análisis de respuestas a preguntas individuales
Esto da un análisis de frecuencia de las diferentes respuestas que se dieron para cada parte de la pregunta. Los detalles del análisis dependen del tipo de pregunta, y no todos los tipos de preguntas soportan esto. Por ejemplo, las preguntas de ensayo (respuesta abierta) no pueden ser analizadas.
Análisis de respuestas a preguntas aleatorias
A partir de Moodle 3.4.3 en adelante se corrigió un problema en el reporte de estadísticas para mostrar las preguntas elegidas para posiciones de preguntas aleatorias (https://tracker.moodle.org/browse/MDL-61950 MDL61950).
Interpretación del Índice de dificultad y del coeficiente de discriminación
Vea Significado de las estadísticas del examen de Moodle


