Viewing Questionnaire responses: Difference between revisions
(what's the best way of making questionnaire results available to respondents?) |
|||
| (25 intermediate revisions by 4 users not shown) | |||
| Line 1: | Line 1: | ||
{{Questionnaire}} | {{Questionnaire}} | ||
== All responses == | |||
On the Questionnaire Report page, users with the necessary permissions can view a statistical Summary of all the responses given to a Questionnaire instance so far. | |||
===Responses display by question type=== | |||
====Numeric==== | |||
[[ | [[Image:05-08-2013 16-34-46.jpg]] | ||
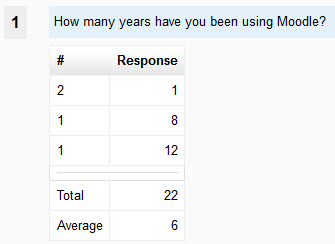
Column 1 displays the number of similar responses. Column 2 displays the responses given. The Total and Average cells are self-explanatory. | |||
====Yes/No==== | |||
[[Image:05-08-2013 16-41-00.jpg]] | |||
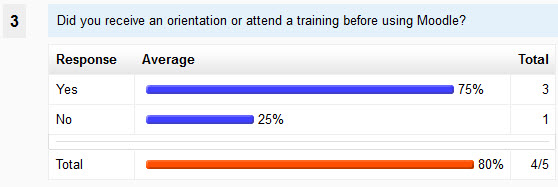
This screenshot shows that out of 5 respondents who responded to this questionnaire, one did not answer this Yes/No question (which was not set as Required). 3 respondents answered Yes (75%) and 1 answered No (25%). Please note that the percentages are calculated on the actual responses, not the total of those who submitted the questionnaire. | |||
====Radio buttons==== | |||
[[Image:05-08-2013 16-46-07.jpg]] | |||
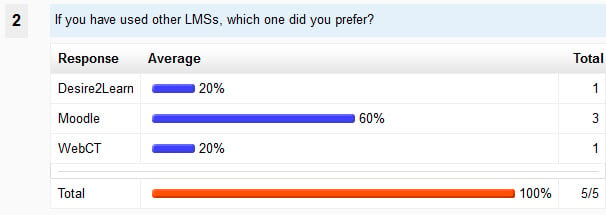
This screenshot shows that 5 our 5 respondents who submitted this questionnaire answered that question (which was Required). | |||
====Check boxes==== | |||
[[Image:05-08-2013 16-50-19.jpg]] | |||
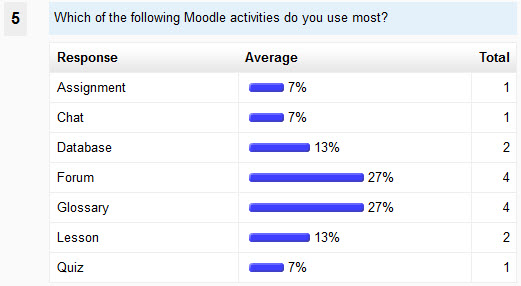
This screenshot shows for instance that the Forum and Glossary activities are favoured by 4 respondents (out of 5 who responded), accounting for 27% of the choices each. | |||
====Rate question==== | |||
[[Image:05-08-2013 16-54-34.jpg]] | |||
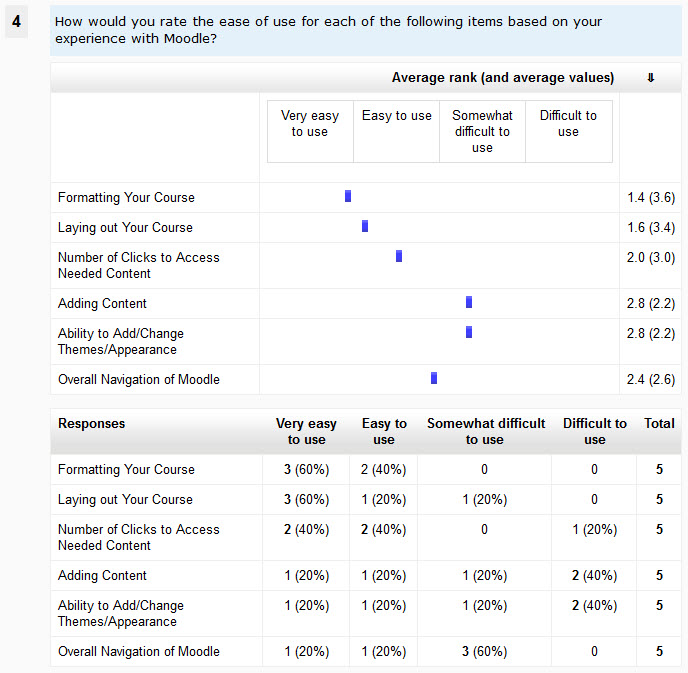
The statistics for Rate questions display 2 tables. | |||
The '''top table''' displays the Average rank for each feature. In this screenshot, the "Formatting your course" feature of Moodle was rated on average 1.4 on the 1 to 4 scale of difficulty, i.e. that feature was rated as between "Very..." and "Easy..." to use. | |||
When creating that Rate question, the following values were entered for each "possible answer": | |||
* 4=Very easy to use | |||
* 3=Easy to use | |||
* 2=Somewhat difficult to use | |||
* 1=Difficult to use | |||
That is to say that the highest "mark" or "value" was given to the easiest choice. | |||
So, the average values (between parentheses) immediately after the average ranks are here the inverse of the average ranks. | |||
The '''bottom table''' displays for each feature the number and percentage of respondents who selected each choice. For instance, for the "Formatting your course" feature, 3 respondents (60% of respondents to that question) selected the "Very easy to use" choice, and 2 respondents (40% of respondents to that question) selected the "Easy to use" choice. Nobody selected the "Difficult" choices for that feature. | |||
====Essay question==== | |||
[[Image:05-08-2013 19-04-02.jpg]] | |||
If the questionnaire is set to "full name" (i.e. non anonymous), the respondent's name will be displayed next to their Essay response. Click on the respondent's name to view their full submission. | |||
===Group filtering=== | |||
[[Image:16-10-2013 13-45-08.jpg]] | |||
If the questionnaire is set to '''Group Mode''': ''Visible groups'', or is set to ''Separate groups'' and the current user has the ''moodle/site:accessallgroups capability'' (in the current context), and groups have been defined in the current course, then the user has access to a dropdown list of groups. This dropdown list enables the user to "filter" the questionnaire responses by groups. If the setting is '''Group Mode''': ''Separate groups'', then users who do not have the ''moodle/site:accessallgroups'' capability (usually students, or non-editing teachers, etc.) will only be able to view the responses of the group(s) they belong to. | |||
* ''All participants'' includes responses from all the people who answered the questionnaire, including people not belonging to any group. | |||
'''Important'''.- After you have used the dropdown list to select a "set of people" for displaying their responses, the "filter" remains active for the following operations: '''Download in text format''', '''Delete ALL Responses''' and '''View by Response'''. For example, if you selected to display '''All Responses''' for group "Sparrows" and then click on the '''Delete ALL Responses''' tab link, a confirmation message will ask you to confirm that you want to delete all responses for members of group "Sparrows" and only responses of those participants. | |||
'''Note'''.- If a participant belongs to more than one group, then deleting all the responses for ''one of the Groups'' he belongs to will of course delete his responses from ''all the other groups'' he belongs to. | |||
===List of responses=== | |||
==== View Individual Responses ==== | |||
If the questionnaire '''Respondent Type''' was set as “fullname”, users with the necessary permissions (usually only teachers or tutors) can view each response individually. | |||
On the List of responses page, each respondent's name is displayed, in alphabetical order of the family name. | |||
Upon mouseover, a tooltip displays the submission time-stamp. This is especially useful in case the questionnaire is set to answer more than once and some students have submitted more than one response. | |||
Click on a respondent's name to display their submission to the questionnaire. | |||
====Individual Responses Navigation==== | |||
[[File:05-08-2013 18-46-20.jpg]] | |||
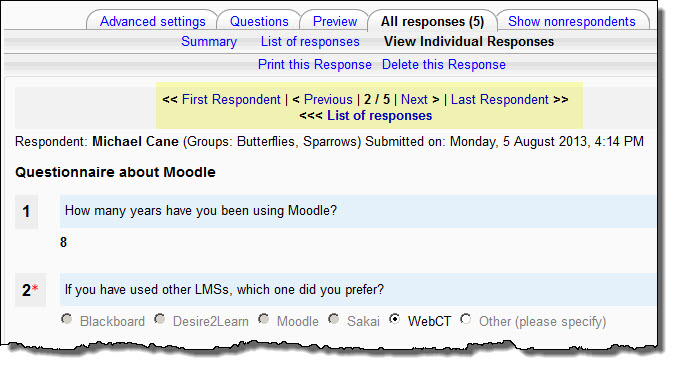
When you are viewing a respondent's individual response, use the navigation bar at the top to go to the Previous (in alphabetical order) or Next response. You can go back to the List of responses page at any time. | |||
==== Print this Response ==== | |||
Opens printer-friendly window with current Response. | |||
==== Delete this Response ==== | |||
Deletes current response. | |||
=== Order Responses === | |||
When displaying All Responses you can order the choices by number of responses (the Average column) for the following 4 types of questions. | |||
* single choices radio button | |||
* single choices drop-down list | |||
* multiple choices (check boxes) | |||
* rate questions (including Likert scales). | |||
When you arrive on the All Responses page, by default all responses are ordered in the order that the questionnaire creator entered the question choices. You can choose to order them by ascending or descending order. | |||
=== Delete All Responses === | |||
Deletes all responses in current questionnaire instance. Can be used to “reset” a questionnaire if you no longer need the current data. | |||
=== Download in text format === | |||
This feature enables you to save all the responses of a questionnaire to a text file (CSV). This file can then be imported into a spreadsheet (e.g. MS Excel or Open Office Calc) or a statistical package for further processing the data. | |||
====Options for text download==== | |||
On the '''Download in text format''' page you have a set of 2 options which only concern the output of the radio buttons/single answer question type. Here is how these options work. | |||
Question text: What is your favorite color? Choice: blue, green, red. | |||
{| style="border-spacing:0;" | |||
| style="border-top:0.092cm double #808080;border-bottom:0.092cm double #808080;border-left:0.092cm double #808080;border-right:none;padding:0.049cm;"| selected color | |||
| style="border-top:0.092cm double #808080;border-bottom:0.092cm double #808080;border-left:0.092cm double #808080;border-right:none;padding:0.049cm;"| blue | |||
| style="border-top:0.092cm double #808080;border-bottom:0.092cm double #808080;border-left:0.092cm double #808080;border-right:none;padding:0.049cm;"| green | |||
| style="border:0.092cm double #808080;padding:0.049cm;"| red | |||
|- | |||
| style="border-top:none;border-bottom:0.092cm double #808080;border-left:0.092cm double #808080;border-right:none;padding:0.049cm;"| Include choice codes | |||
| style="border-top:none;border-bottom:0.092cm double #808080;border-left:0.092cm double #808080;border-right:none;padding:0.049cm;"| 1 | |||
| style="border-top:none;border-bottom:0.092cm double #808080;border-left:0.092cm double #808080;border-right:none;padding:0.049cm;"| 2 | |||
| style="border-top:none;border-bottom:0.092cm double #808080;border-left:0.092cm double #808080;border-right:0.092cm double #808080;padding:0.049cm;"| 3 | |||
|- | |||
| style="border-top:none;border-bottom:0.092cm double #808080;border-left:0.092cm double #808080;border-right:none;padding:0.049cm;"| Include choice text | |||
| style="border-top:none;border-bottom:0.092cm double #808080;border-left:0.092cm double #808080;border-right:none;padding:0.049cm;"| blue | |||
| style="border-top:none;border-bottom:0.092cm double #808080;border-left:0.092cm double #808080;border-right:none;padding:0.049cm;"| green | |||
| style="border-top:none;border-bottom:0.092cm double #808080;border-left:0.092cm double #808080;border-right:0.092cm double #808080;padding:0.049cm;"| red | |||
|- | |||
| style="border-top:none;border-bottom:0.092cm double #808080;border-left:0.092cm double #808080;border-right:none;padding:0.049cm;"| Include choice codes + Include choice text | |||
| style="border-top:none;border-bottom:0.092cm double #808080;border-left:0.092cm double #808080;border-right:none;padding:0.049cm;"| 1 : blue | |||
| style="border-top:none;border-bottom:0.092cm double #808080;border-left:0.092cm double #808080;border-right:none;padding:0.049cm;"| 2 : green | |||
| style="border-top:none;border-bottom:0.092cm double #808080;border-left:0.092cm double #808080;border-right:0.092cm double #808080;padding:0.049cm;"| 3 : red | |||
|- | |||
| style="border-top:none;border-bottom:0.092cm double #808080;border-left:0.092cm double #808080;border-right:none;padding:0.049cm;"| No Include box ticked = same as include choice text box ticked | |||
| style="border-top:none;border-bottom:0.092cm double #808080;border-left:0.092cm double #808080;border-right:none;padding:0.049cm;"| blue | |||
| style="border-top:none;border-bottom:0.092cm double #808080;border-left:0.092cm double #808080;border-right:none;padding:0.049cm;"| green | |||
| style="border-top:none;border-bottom:0.092cm double #808080;border-left:0.092cm double #808080;border-right:0.092cm double #808080;padding:0.049cm;"| red | |||
|} | |||
Note that these output options are over-ridden in case you used the "hidden" option when you created your radio button questions, i.e. the named values will be exported as data. | |||
{| style="border-spacing:0;" | |||
| style="width:33%; border-top:0.092cm double #808080;border-bottom:0.092cm double #808080;border-left:0.092cm double #808080;border-right:none;padding:0.132cm;"| ''Possible answers: '' | |||
Red=the color of blood | |||
Blue=the color of the sky | |||
Black=opposite of white | |||
| style="width:33%; border-top:0.092cm double #808080;border-bottom:0.092cm double #808080;border-left:0.092cm double #808080;border-right:none;padding:0.132cm;"| '''What is your favorite color?''' | |||
the color of blood | |||
the color of the sky | |||
opposite of white | |||
| style="width:33%; border:0.092cm double #808080;padding:0.132cm;"| ''Irrespective of the Include choice codes/text options selected on the Download in text format page, this will output the values '''Red''', '''Blue''' or '''Black''' to the CSV file.'' | |||
|} | |||
====The CSV file (how to use it)==== | |||
The text format available here is of the so-called CSV (comma separated values) type. However, for more universal use, the '''tab''' (tabulation) separator is used, rather than the comma or semi-colon. | |||
When you click on the '''Download in text format''' button, a window opens, asking you whether you'd like to save the data file or open it. Select ''save''. The data file is named after the name of the current quiz, however you can save it under a different name. The proposed data file extension is *.txt, but you ''can'' rename it. Note that you ''must'' rename it with a *.csv extension for import into ''Open Office Calc'' or ''LibreOffice Calc''. | |||
Then go to your external software, and open the file into it. The following operations depend on the software you are using and on a number of other parameters. If you are using a non-ascii language interface in Moodle or you are using the English language but some of your questionnaire questions (or responses) have non-ascii characters in them, then ''Excel'' (or ''Open Office Calc'') might be able to ''automatically detect'' that your file is UTF-8 encoded, and decode it accordingly. Please note that if most of your data file is using standard ascii characters and only a very small number of non-ascii characters are present, the automatic detection will not work, and you will have to ''manually'' select the UTF-8 encoding in the list provided by your software. | |||
At the top of the "table" imported into e.g. ''Excel'', the first line contains the names of all the question fields. This is followed by one line per response. The first 7 fields are as follows (in the English version): | |||
{| style="border-spacing:0;" | |||
| style="border-top:0.092cm double #808080;border-bottom:0.092cm double #808080;border-left:0.092cm double #808080;border-right:none;padding:0.079cm;"| Response | |||
| style="border-top:0.092cm double #808080;border-bottom:0.092cm double #808080;border-left:0.092cm double #808080;border-right:none;padding:0.079cm;"| Submitted on: | |||
| style="border-top:0.092cm double #808080;border-bottom:0.092cm double #808080;border-left:0.092cm double #808080;border-right:none;padding:0.079cm;"| Institution | |||
| style="border-top:0.092cm double #808080;border-bottom:0.092cm double #808080;border-left:0.092cm double #808080;border-right:none;padding:0.079cm;"| Department | |||
| style="border-top:0.092cm double #808080;border-bottom:0.092cm double #808080;border-left:0.092cm double #808080;border-right:none;padding:0.079cm;"| Course | |||
| style="border-top:0.092cm double #808080;border-bottom:0.092cm double #808080;border-left:0.092cm double #808080;border-right:none;padding:0.079cm;"| Group | |||
| style="border-top:0.092cm double #808080;border-bottom:0.092cm double #808080;border-left:0.092cm double #808080;border-right:none;padding:0.079cm;"| ID | |||
| style="border-top:0.092cm double #808080;border-bottom:0.092cm double #808080;border-left:0.092cm double #808080;border-right:none;padding:0.079cm;"| Full name | |||
| style="border:0.092cm double #808080;padding:0.079cm;"| Username | |||
|} | |||
The submitted_date field contains the date (and time, i.e. hour minutes seconds) when the response was submitted by respondent. For example: 15/09/2007 15:57. Normally you should be able to use Excel cell formatting to display such dates at will, in your own language formatting conventions, including the seconds, and if you wish full day or months names, while retaining the sorting facility. | |||
If the questionnaire was set as "anonymous responses", the ID and Username will be empty and the Full name field will display "Anonymous". | |||
== Your responses == | |||
On the Questionnaire Report page, users with the necessary permissions can view their own responses on the page entitled “Your results”. Usually students will be allowed to view their own responses. | |||
If the questionnaire's settings allow more than one response and more than one response have been entered by the current user, then all of the features of the “View All responses” explained above apply. | |||
However, it is not possible to delete individual responses in this “Your responses” view. And the Download as text format is not available to users with the student role. | |||
=== All your responses === | |||
This provides a view of all of a respondent's responses, on successive dates. This feature may be useful if a questionnaire is used as a kind of portfolio. | |||
== Show Non-Respondents == | |||
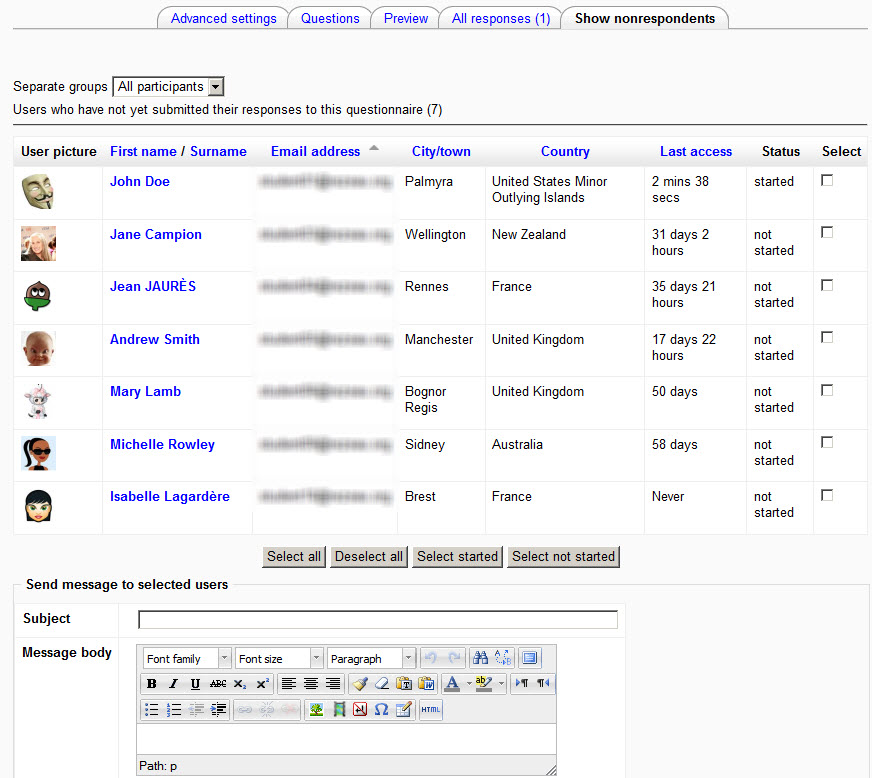
This feature allows the teacher to see students who have not yet responded. A reminder message can be sent to individuals or to everyone that hasn’t submitted responses. | |||
The list of "non-respondents" can be filtered by Group (if Groups are enabled for this course and activity). | |||
If the questionnaire's '''Save/Resume answers''' is set to Yes, then the list shows those students who have started but not yet submitted their questionnaire responses. | |||
[[Image:05-08-2013 16-15-58.jpg]] | |||
[[fr:Voir_les_réponses_du_Questionnaire]] | |||
[[es:Viendo respuestas de un cuestionario]] | |||
Latest revision as of 07:20, 10 April 2014
All responses
On the Questionnaire Report page, users with the necessary permissions can view a statistical Summary of all the responses given to a Questionnaire instance so far.
Responses display by question type
Numeric
Column 1 displays the number of similar responses. Column 2 displays the responses given. The Total and Average cells are self-explanatory.
Yes/No
This screenshot shows that out of 5 respondents who responded to this questionnaire, one did not answer this Yes/No question (which was not set as Required). 3 respondents answered Yes (75%) and 1 answered No (25%). Please note that the percentages are calculated on the actual responses, not the total of those who submitted the questionnaire.
Radio buttons
This screenshot shows that 5 our 5 respondents who submitted this questionnaire answered that question (which was Required).
Check boxes
This screenshot shows for instance that the Forum and Glossary activities are favoured by 4 respondents (out of 5 who responded), accounting for 27% of the choices each.
Rate question
The statistics for Rate questions display 2 tables.
The top table displays the Average rank for each feature. In this screenshot, the "Formatting your course" feature of Moodle was rated on average 1.4 on the 1 to 4 scale of difficulty, i.e. that feature was rated as between "Very..." and "Easy..." to use. When creating that Rate question, the following values were entered for each "possible answer":
- 4=Very easy to use
- 3=Easy to use
- 2=Somewhat difficult to use
- 1=Difficult to use
That is to say that the highest "mark" or "value" was given to the easiest choice. So, the average values (between parentheses) immediately after the average ranks are here the inverse of the average ranks.
The bottom table displays for each feature the number and percentage of respondents who selected each choice. For instance, for the "Formatting your course" feature, 3 respondents (60% of respondents to that question) selected the "Very easy to use" choice, and 2 respondents (40% of respondents to that question) selected the "Easy to use" choice. Nobody selected the "Difficult" choices for that feature.
Essay question
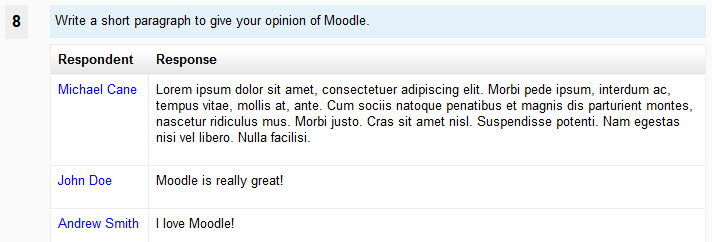 If the questionnaire is set to "full name" (i.e. non anonymous), the respondent's name will be displayed next to their Essay response. Click on the respondent's name to view their full submission.
Group filtering
If the questionnaire is set to Group Mode: Visible groups, or is set to Separate groups and the current user has the moodle/site:accessallgroups capability (in the current context), and groups have been defined in the current course, then the user has access to a dropdown list of groups. This dropdown list enables the user to "filter" the questionnaire responses by groups. If the setting is Group Mode: Separate groups, then users who do not have the moodle/site:accessallgroups capability (usually students, or non-editing teachers, etc.) will only be able to view the responses of the group(s) they belong to.
- All participants includes responses from all the people who answered the questionnaire, including people not belonging to any group.
Important.- After you have used the dropdown list to select a "set of people" for displaying their responses, the "filter" remains active for the following operations: Download in text format, Delete ALL Responses and View by Response. For example, if you selected to display All Responses for group "Sparrows" and then click on the Delete ALL Responses tab link, a confirmation message will ask you to confirm that you want to delete all responses for members of group "Sparrows" and only responses of those participants.
Note.- If a participant belongs to more than one group, then deleting all the responses for one of the Groups he belongs to will of course delete his responses from all the other groups he belongs to.
List of responses
View Individual Responses
If the questionnaire Respondent Type was set as “fullname”, users with the necessary permissions (usually only teachers or tutors) can view each response individually. On the List of responses page, each respondent's name is displayed, in alphabetical order of the family name. Upon mouseover, a tooltip displays the submission time-stamp. This is especially useful in case the questionnaire is set to answer more than once and some students have submitted more than one response. Click on a respondent's name to display their submission to the questionnaire.
When you are viewing a respondent's individual response, use the navigation bar at the top to go to the Previous (in alphabetical order) or Next response. You can go back to the List of responses page at any time.
Print this Response
Opens printer-friendly window with current Response.
Delete this Response
Deletes current response.
Order Responses
When displaying All Responses you can order the choices by number of responses (the Average column) for the following 4 types of questions.
- single choices radio button
- single choices drop-down list
- multiple choices (check boxes)
- rate questions (including Likert scales).
When you arrive on the All Responses page, by default all responses are ordered in the order that the questionnaire creator entered the question choices. You can choose to order them by ascending or descending order.
Delete All Responses
Deletes all responses in current questionnaire instance. Can be used to “reset” a questionnaire if you no longer need the current data.
Download in text format
This feature enables you to save all the responses of a questionnaire to a text file (CSV). This file can then be imported into a spreadsheet (e.g. MS Excel or Open Office Calc) or a statistical package for further processing the data.
Options for text download
On the Download in text format page you have a set of 2 options which only concern the output of the radio buttons/single answer question type. Here is how these options work.
Question text: What is your favorite color? Choice: blue, green, red.
| selected color | blue | green | red |
| Include choice codes | 1 | 2 | 3 |
| Include choice text | blue | green | red |
| Include choice codes + Include choice text | 1 : blue | 2 : green | 3 : red |
| No Include box ticked = same as include choice text box ticked | blue | green | red |
Note that these output options are over-ridden in case you used the "hidden" option when you created your radio button questions, i.e. the named values will be exported as data.
| Possible answers:
Red=the color of blood Blue=the color of the sky Black=opposite of white |
What is your favorite color?
the color of blood the color of the sky opposite of white |
Irrespective of the Include choice codes/text options selected on the Download in text format page, this will output the values Red, Blue or Black to the CSV file. |
The CSV file (how to use it)
The text format available here is of the so-called CSV (comma separated values) type. However, for more universal use, the tab (tabulation) separator is used, rather than the comma or semi-colon.
When you click on the Download in text format button, a window opens, asking you whether you'd like to save the data file or open it. Select save. The data file is named after the name of the current quiz, however you can save it under a different name. The proposed data file extension is *.txt, but you can rename it. Note that you must rename it with a *.csv extension for import into Open Office Calc or LibreOffice Calc.
Then go to your external software, and open the file into it. The following operations depend on the software you are using and on a number of other parameters. If you are using a non-ascii language interface in Moodle or you are using the English language but some of your questionnaire questions (or responses) have non-ascii characters in them, then Excel (or Open Office Calc) might be able to automatically detect that your file is UTF-8 encoded, and decode it accordingly. Please note that if most of your data file is using standard ascii characters and only a very small number of non-ascii characters are present, the automatic detection will not work, and you will have to manually select the UTF-8 encoding in the list provided by your software.
At the top of the "table" imported into e.g. Excel, the first line contains the names of all the question fields. This is followed by one line per response. The first 7 fields are as follows (in the English version):
| Response | Submitted on: | Institution | Department | Course | Group | ID | Full name | Username |
The submitted_date field contains the date (and time, i.e. hour minutes seconds) when the response was submitted by respondent. For example: 15/09/2007 15:57. Normally you should be able to use Excel cell formatting to display such dates at will, in your own language formatting conventions, including the seconds, and if you wish full day or months names, while retaining the sorting facility.
If the questionnaire was set as "anonymous responses", the ID and Username will be empty and the Full name field will display "Anonymous".
Your responses
On the Questionnaire Report page, users with the necessary permissions can view their own responses on the page entitled “Your results”. Usually students will be allowed to view their own responses.
If the questionnaire's settings allow more than one response and more than one response have been entered by the current user, then all of the features of the “View All responses” explained above apply.
However, it is not possible to delete individual responses in this “Your responses” view. And the Download as text format is not available to users with the student role.
All your responses
This provides a view of all of a respondent's responses, on successive dates. This feature may be useful if a questionnaire is used as a kind of portfolio.
Show Non-Respondents
This feature allows the teacher to see students who have not yet responded. A reminder message can be sent to individuals or to everyone that hasn’t submitted responses.
The list of "non-respondents" can be filtered by Group (if Groups are enabled for this course and activity).
If the questionnaire's Save/Resume answers is set to Yes, then the list shows those students who have started but not yet submitted their questionnaire responses.
