Outcomes Instructor Specification
Description
Instructors are where Outcomes really get implemented. Instructors have the responsibility, in an outcomes driven system, to map content against outcomes, to monitor student progress, and to respond when students appear to have a problem.
Course Settings and Course Outcomes
If instructors have the capabilities, they can map their course against outcomes that have already been added to the system, or they can create their own outcomes that are specific to the course. This all happens in the Course Settings Page.
Empty State
File:Edit Course - Empty - Course Level
Mapped State
Resource / Activity Mapping
The most basic task that is required to make outcome driven learning work is the mapping of specific content items, resources, activities, and quiz questions, against outcomes. This takes place on the Activity creation/editing screen.
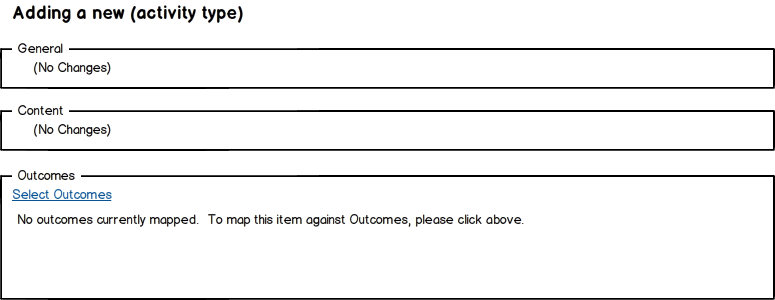
Empty State - Course Not Mapped
If the course has not been mapped against outcomes, it appears in this empty state. The user can click on Select Outcome Sets to choose outcomes sets to map against.
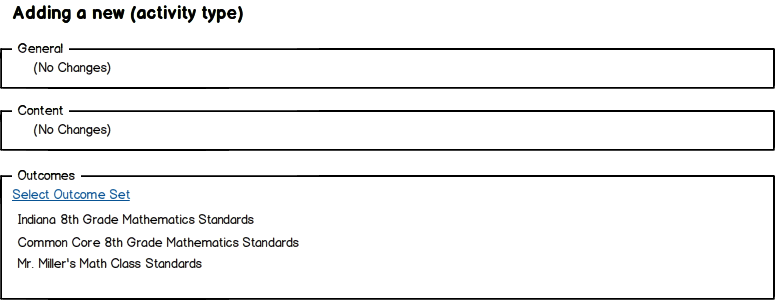
Empty State - Course Mapped, Activity Not Mapped
When a course is mapped against Outcome Sets, those sets appear in the Activity mapping screen. The user can select additional Outcome Sets, or they can click on the individual Outcome Sets to select specific outcomes to map against.
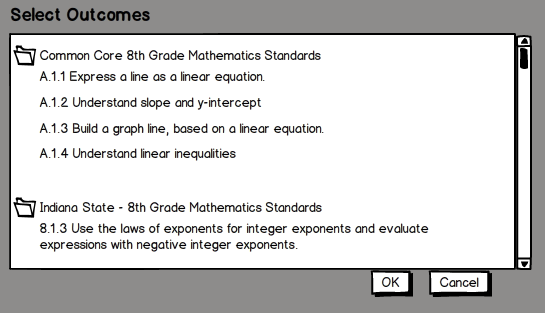
Outcome Mapping Screen
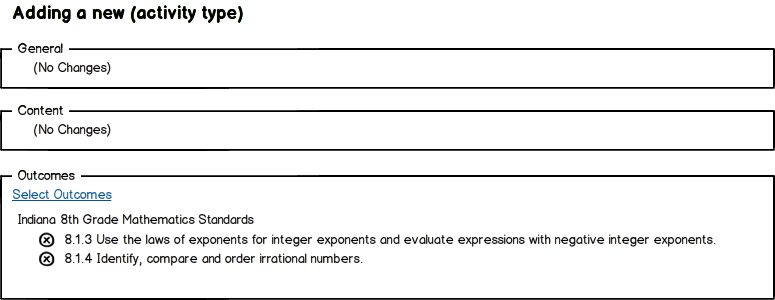
When a user decides to map individual outcomes against a resource, this screen allows them to do so. They simply click on an outcome, which, once selected is highlighted. Once they click “OK” the outcomes are added back to the main resource screen, as shown below.
Mapped State - Course Mapped, Activity Mapped
Quiz Question Mapping
Mapping of quiz questions will happen identically to the way that regular content items are mapped, but on the quiz creation screen.
Rubric Mapping
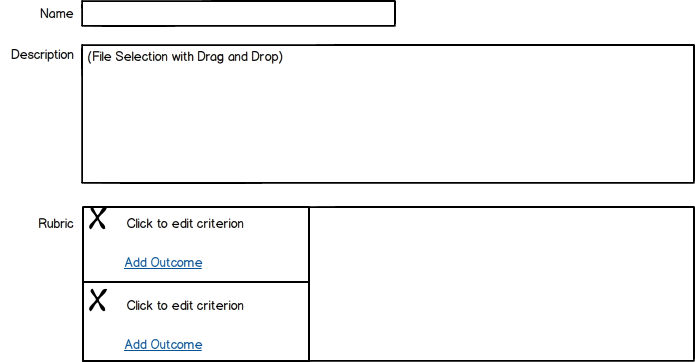
Mappings against Rubric Rows will happen similar to content items, but will happen in the context of the criterion. This should be true of other advanced grading methodologies as well, with a framework for other grading methods to interact with outcomes.
Add Outcome
This will launch the add outcome screen, allowing the user to select the outcome that maps against this particular criterion.
Instructor Reporting
One of the key drivers of Outcome driven design of courses is to allow instructors to see how their students are performing against outcomes and to provide accountability data on the instruction.
Instructor Coverage Reporting
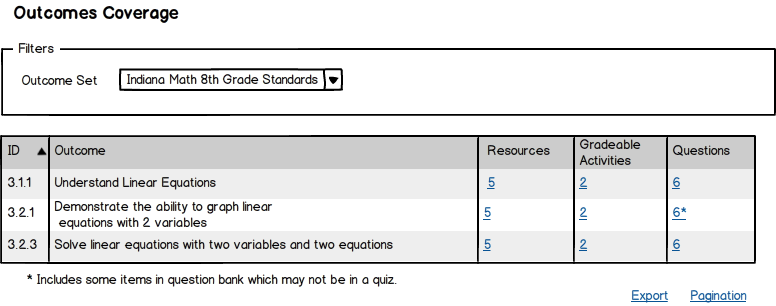
The coverage report shows all outcome sets that have been mapped against this course, lists out all outcomes within a given outcome set, and shows any resources, quiz questions, or activities that are mapped against those particular outcomes. The goal is to allow instructors to quickly see if they have covered all of the outcomes with content, and how deep that coverage is for each outcome.
- Filters:
- Outcome Set – Shows all outcome sets that are mapped against this course.
- Report:
Lists off ALL outcomes within an outcome set, including ones that have nothing mapped.
- ID: the logical identifier of the outcome.
- Outcome: The text of the outcome
- Resources: The number of resources mapped (on hover or click, pops up list)
- Gradeable Activities: # of gradeable activities mapped (on hover or click, pops up list)
- Questions: # of quiz questions mapped (on hover or click, pops up list)
Pagination and the ability to export are also included.
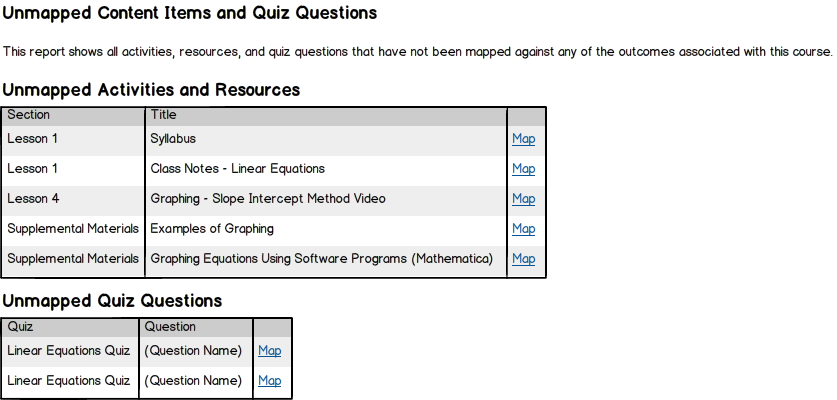
Instructor Unmapped Content Report
This report shows all unmapped activities, resources, and questions. It gives the instructor the ability to jump directly to the item to map it, if necessary.
Instructor Course Performance Reporting
Performance reporting is more complex, because it has to deal with various types of resources, and their relative importance. There are three types of reporting we want to achieve:
- Resource activity reporting: have there been interactions with resources that are mapped to outcomes.
- Completion Reporting: for instructors that use completion, we should report about the percentage completion for those items.
- Grade Reporting: What are the average grades for gradeable items that are mapped to outcomes.
- Filters:
- Outcome Set: Lists off the various outcome sets and allows selection. It is required to select an outcome before running the report.
- Group – Default is “All Groups.” Filters the performance report down to users in a specific group
- Report
- ID – Logical ID of the Outcome
- Outcome – Text of the outcome
- Completion Percentage – This is the percentage completion by the students in courses who have access to the mapped activities. If there are no resources with completion turned on, it will read N/A.
- Average Grade – For any graded resources that are mapped against this outcome, this is the average grade of the students. If there are no graded activities, it will read N/A.
- Associated Activities – List of the mapped activities/resources. If the list is more than 3, then it will display ellipses (…) and you can hover or click to see the full list. On hover, it displays the individual item in the list with its own statistics.
The links for Completion and Grade Reports launch modal windows with the detailed information:
Instructor Student Performance Reporting
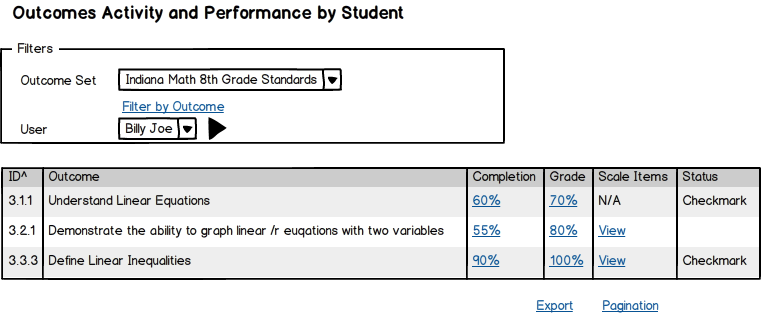
On an individual student basis, we can actual display all of the standards with all associated activities, performance, interactions, etc.
- Filters:
- Outcome Set – List of all outcome sets mapped to this course.
- Filter by Outcome - Allows you to further refine the list of outcomes
- User – Roster of students
- Next Link – Takes me to the next Student
- Report: This is a list of all outcomes in this outcome set, and the student’s associated performance.
- ID – Logical ID of the Outcome
- Outcome – Text of the Outcome
- Completion – The completion of resources that are mapped against this outcome. Hyperlinked to a full log report of those resource completion. If none, it is 0. If there are no resources, it is N/A.
- Average Grade - For any graded resources that are mapped against this outcome, this is the average grade of the students. If there are no graded activities, it will read N/A.
- Status – Based on this schools configuration of streaks and “At Risk” this will display either a check for “Mastery”, a warning sign for “At Risk”, and blank for any other state.
Instructor Student Completion Marking
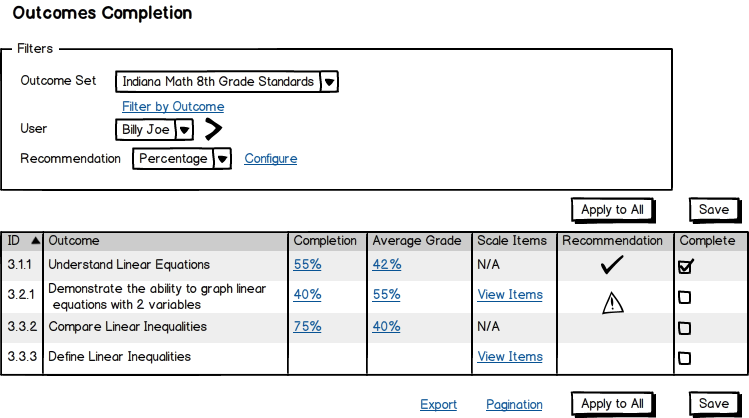
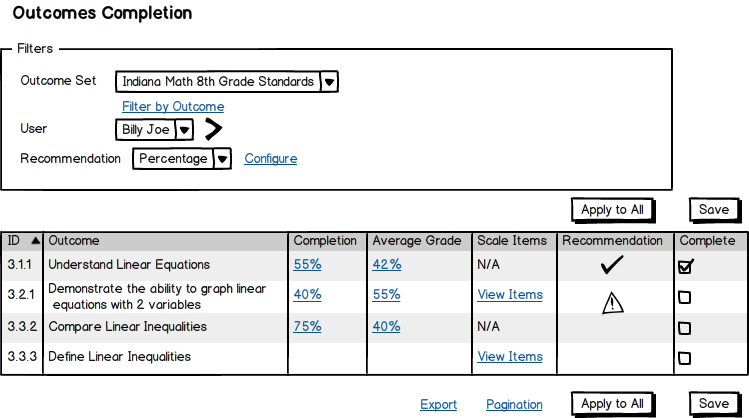
On an individual student basis, we can actual display all of the standards with all associated activities, performance, interactions, etc. The Instructor can then mark them as complete based on the recommendations and data.
- Filters:
- Outcome Set – List of all outcome sets mapped to this course.
- Filter by Outcome - Allows you to refine to other Outcomes.
- User – Roster of students
- Next Link – Takes me to the next Student
- Recommendation - This changes which engine is used to provide the instructor with a recommendation for marking completion of outcomes. Initially, this will probably have None, Percentage Correct, and Streak.
- Report: This is a list of all outcomes in this outcome set, and the student’s associated performance.
- ID – Logical ID of the Outcome
- Outcome – Text of the Outcome
- Completion – The percentage of completion of resources that are mapped against this outcome. Hyperlinked to a full log report of those resource views. If none, it is 0. If there are no resources, it is N/A.
- Average Grade - For any graded resources that are mapped against this outcome, this is the average grade of the students. If there are no graded activities, it will read N/A.
- Recommendation – Based on this schools configuration of streaks and “At Risk” this will display either a check for “Mastery”, a warning sign for “At Risk”, and blank for any other state.
- Complete - Checkbox where instructor can mark whether or not they believe the student has completed this outcome, based on the percentage, etc.
