Diferencia entre revisiones de «Reporte de estadísticas de examen»
(spanish translation (in progress) by German Valero) |
m (spanish translation (in progress) by German Valero, 2nd stage) |
||
| Línea 2: | Línea 2: | ||
''Navegación > Curso > Nombre del examen > Resultados > Estadísticas'' | ''Navegación > Curso > Nombre del examen > Resultados > Estadísticas'' | ||
Este reporte da un análisis estadístico (psicométrico) del examen (cuestionario), y de sus preguntas. La parte superior del reporte da un resumen del examen (cuestionario) completo. | Este reporte da un análisis estadístico (psicométrico) del examen (cuestionario), y de sus preguntas. La parte superior del reporte da un resumen del examen (cuestionario) completo. La siguiente sección da un análisis que muestra todas las preguntas en un formato de tabla. Hay ligas en esta sección, para editar preguntas individuales o entrar en un análisis detallado de una pregunta en particular. La última parte de este reporte es una gráfica de barras del porcentaje de respuestas correctas (Índice de Facilidad) y del índice de Eficiencia Discriminatoria. | ||
El reporte completo (vista general, y análisis detallado de todas las preguntas) se puede descargar en una variedad de formatos, al igual que la tabla del anáisis de la estructura del examen (cuestionario). | |||
Para una introducción general a psicometría, este seminario [http://www.youtube.com/watch?v=F5Lu3EdsXNo&NR=1 45-minute seminar] proporciona una introducción de forma muy accesible. | |||
=== | ===Estadísticas generales del examen=== | ||
Aquí están los detalles sobre la informaciónde este reporte robusto. | |||
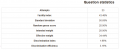
==== | ====Información del examen==== | ||
Esta sección proporciona alguna información básica sobre la prueba como un todo. Usted verá: | |||
* | * Nombre del examen | ||
* | * Nombre del curso | ||
* | * Fechas de apertura y cierre (si aplican) | ||
* | * Número total de intentos (primeros/calificados) | ||
* | * Calificación promedio para intentos primeros/todos | ||
* | * Mediana de calificación | ||
* | * Desviación estándar de calificaciones | ||
* [http://en.wikipedia.org/wiki/Skewness Skewness] and [http://en.wikipedia.org/wiki/Kurtosis Kurtosis] of the grade distribution | * [http://en.wikipedia.org/wiki/Skewness Skewness] and [http://en.wikipedia.org/wiki/Kurtosis Kurtosis] of the grade distribution | ||
* Coefficient of internal consistency (sometimes called [http://en.wikipedia.org/wiki/Cronbach%27s_alpha Cronbach Alpha]) - This is a measure of whether all the items in the quiz are testing basically the same thing. Thus it measures the consistency of the text, which is a lower bound for the validity. Higher numbers here are better. | * Coefficient of internal consistency (sometimes called [http://en.wikipedia.org/wiki/Cronbach%27s_alpha Cronbach Alpha]) - This is a measure of whether all the items in the quiz are testing basically the same thing. Thus it measures the consistency of the text, which is a lower bound for the validity. Higher numbers here are better. | ||
Revisión del 15:53 24 jun 2012
Plantilla:Quiz reports Navegación > Curso > Nombre del examen > Resultados > Estadísticas
Este reporte da un análisis estadístico (psicométrico) del examen (cuestionario), y de sus preguntas. La parte superior del reporte da un resumen del examen (cuestionario) completo. La siguiente sección da un análisis que muestra todas las preguntas en un formato de tabla. Hay ligas en esta sección, para editar preguntas individuales o entrar en un análisis detallado de una pregunta en particular. La última parte de este reporte es una gráfica de barras del porcentaje de respuestas correctas (Índice de Facilidad) y del índice de Eficiencia Discriminatoria.
El reporte completo (vista general, y análisis detallado de todas las preguntas) se puede descargar en una variedad de formatos, al igual que la tabla del anáisis de la estructura del examen (cuestionario).
Para una introducción general a psicometría, este seminario 45-minute seminar proporciona una introducción de forma muy accesible.
Estadísticas generales del examen
Aquí están los detalles sobre la informaciónde este reporte robusto.
Información del examen
Esta sección proporciona alguna información básica sobre la prueba como un todo. Usted verá:
- Nombre del examen
- Nombre del curso
- Fechas de apertura y cierre (si aplican)
- Número total de intentos (primeros/calificados)
- Calificación promedio para intentos primeros/todos
- Mediana de calificación
- Desviación estándar de calificaciones
- Skewness and Kurtosis of the grade distribution
- Coefficient of internal consistency (sometimes called Cronbach Alpha) - This is a measure of whether all the items in the quiz are testing basically the same thing. Thus it measures the consistency of the text, which is a lower bound for the validity. Higher numbers here are better.
- Error ratio - the variation in the grades comes from two sources. First some students are better than others at what is being tested, and second there is some random variation. We hope that the quiz grades will largely be determined by the student's ability, and that random variation will be minimised. The error ratio estimates how much of the variation is random, and so lower is better.
- Standard error - this is derived from the error ratio, and is a measure of how much random variation there is in each test grade. So, if the Standard error is 10%, and a student scored 60%, then their real ability probably lies somewhere between 50% and 70%.

Quiz structure analysis
This section lists all the questions in the quiz with various statistics in a table format.
- Q# - shows the question number (position), question type icon, and preview and edit icons
- Question name - the name is also a link to the detailed analysis of this question (See Quiz Question Statistics below).
- Attempts - how many students attempted this question.
- Facility Index - the percentage of students that answered the question correctly.
- Standard Deviation - how much variation there was in the scores for this question.
- Random guess score - the score the student would get by guessing randomly
- Intended/Effective weight - Intended weight is simply what you set up when editing the quiz. If question 1 is worth 3 marks out of a total of 10 for the quiz, the the intended weight is 30%. The effective weight is an attempt to estimate, from the results, how much of the actual variation was due to this question. So, ideally the effective weights should be close to the intended weights.
- Discrimination index - this is the correlation between the score for this question and the score for the whole quiz. That is, for a good question, you hope that the students who score highly on this question are the same students who score highly on the whole quiz. Higher numbers are better.
- Discriminative efficiency - another measure that is similar to Discrimination index.
- Where random questions are used, there is one row in the table for the random question, followed by further rows, one for each real question that was selected in place of this random question.
- When quiz questions are randomized for each quiz, the quiz module determines a default position.
- Quiz statistics calculations gives further details on all these quantities.

Quiz statistics chart

Quiz question statistics
Navigation > quiz's name > Results > Statistics (click on any question title) It is possible to see the statistics for one question on a single page. This view will also tell you what percentage of quiz takers selected each answer (Analysis of responses) and give you basic information about the question.
- Question information- The basic information about the question, the name of the quiz, the question, the question type, the position in the quiz and the question itself. There are preview and edit icons in this page.
- Question statistics - This repeats the information from the table row from the Quiz structure analysis that relates to this question.
- Report options - You can choose whether to run the report on all attempts, or just the first attempt by each student. Some of the calculations used in the report are based on assumptions that may not apply to quizzes that allow more than one attempt.
:Tip: Computing the statistics takes some time, the report will store the computed values and re-use them for up to 15 minutes. Therefore, there is a display of how recently the statistics were calculated, with a button to recalculate them immediatel

Individual question page preferences
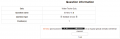
Individual question's information
Individual question's statistic information

Analysis of individual question responses
This gives a frequency analysis of the different responses that were given to each part of the question. The details of the analysis depends on the question type, and not all question types support this. For example, essay question responses cannot be analyzed.
y.